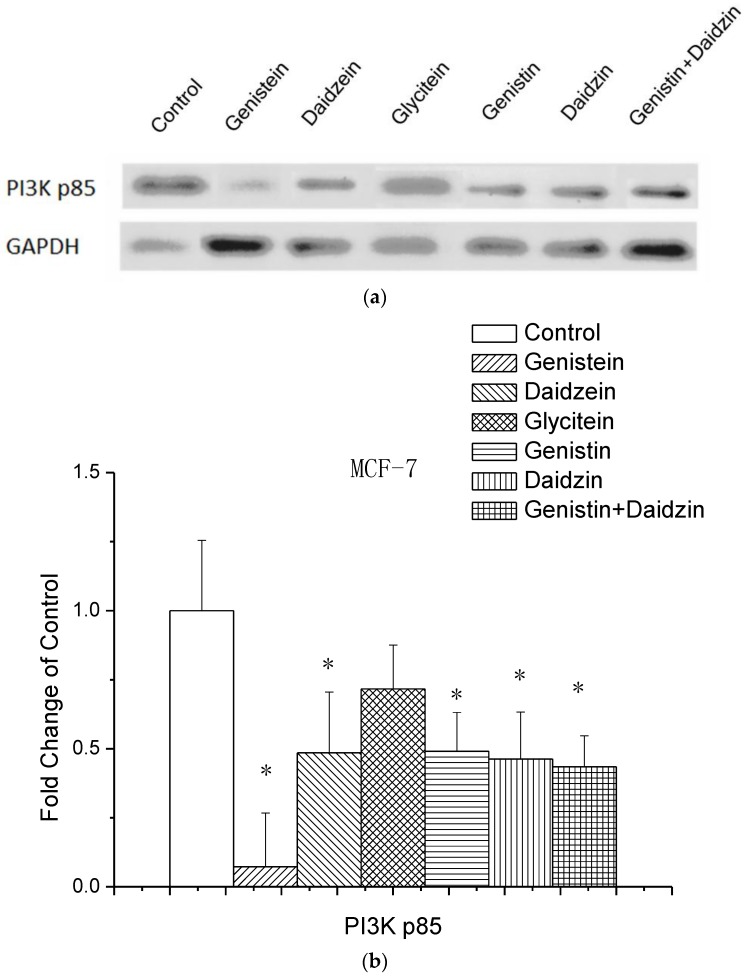
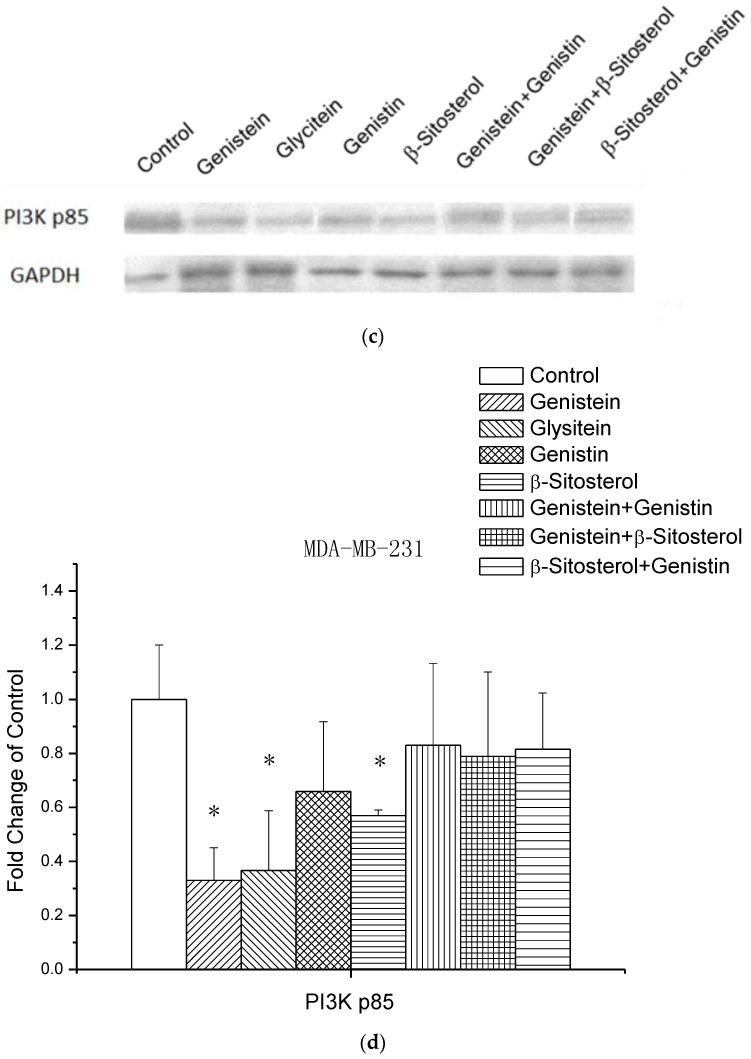
Figure 6.
The protein expression level of PI3K p85. Cells were treated with samples, or control for 72 h. Total protein was extracted for the analysis using Western blot. The signal of target protein in MCF-7 cells (a,b) and MDA-MB-231 cells (c,d) was detected and quantified using SuperSignal ELISA Pico Chemiluminescent Substrate. Data are presented as mean ± SD. * indicates a significant difference compared to the control (p < 0.05).


