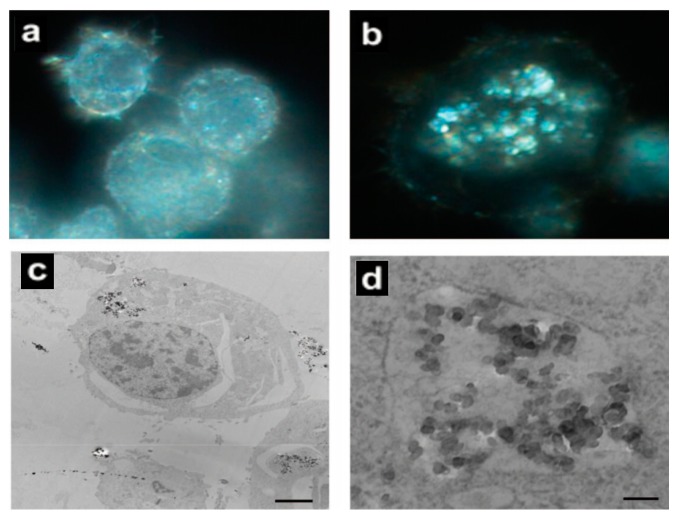
Figure 5.
Comparative study on the uptake of Ag nanoparticles by alveolar macrophages. (a,b) Light microscope images illustrating uptake of nanoparticles in alveolar macrophages at 100× oil magnification after 6 h. (a) Control; (b) Cells treated with 30 nm Ag nanoparticles (25 µg/mL) for 6 h; (c,d) Low-magnification and high-magnification TEM images of cells that internalized 55 nm Ag nanoparticles (25 µg/mL) into vacuoles after 24 h incubation. The scale bars are 2 μm and 500 nm, respectively. (Reproduced with permission [149]).

