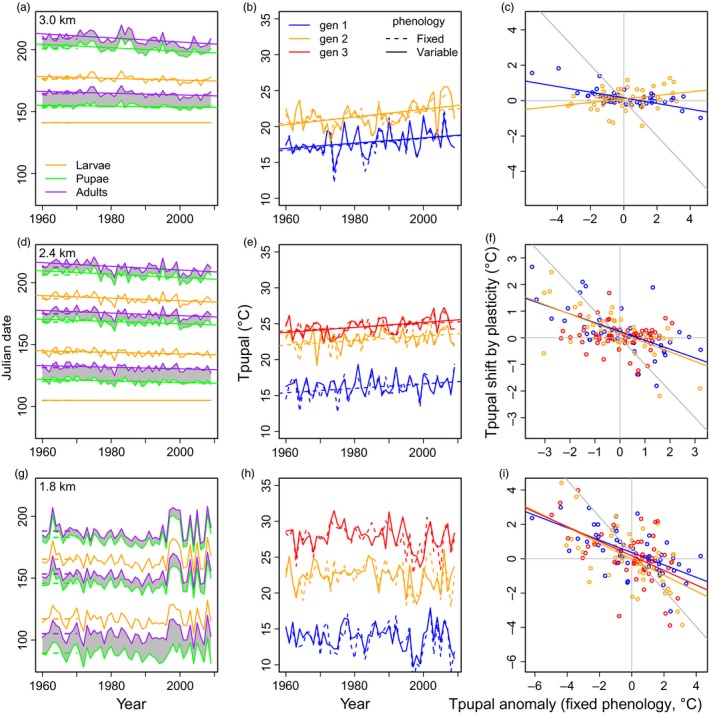
Figure 2.

Predicted seasonal phenology and pupal temperatures across years. Climate and weather differences along the elevation gradient (top row = panels a–c: 3.0 km; middle row = d–f: 2.4 km; bottom row = g–i: 1.8 km) determine phenology and pupal temperatures (dashed lines: fixed phenology, varying phenology: solid lines). First column (panels a, d, g): the mean Julian date of appearance for larvae (orange), pupae (green), and adults (purple; gray shading: pupal duration). The short dashed line depicts the fixed phenology. Second column (panels b, e, h): The annual mean pupal temperature (Tpupal, in °C) during the first (blue), second (orange), and third (red) generations differs between the varying and fixed phenology scenarios. Third column (panels c, f, i): phenological shifts can counter increases in pupal temperatures in warm years. The x‐axis depicts the temperature anomaly each year during the average dates of pupation (i.e., if the average Julian dates for pupation are 150–155, average T for days 150–155 each year – average T for days 150–155 across all years). Thus, positive values indicate that temperatures during the fixed phenology are warmer than average. The y‐axis depicts the shift in pupal temperatures resulting from the varying phenology (i.e., Tpupal for varying phenology – Tpupal for fixed phenology). A gray line corresponds to phenology perfectly tracking pupal temperatures (slope = −1). We depict significant (p < .05) temporal trends
