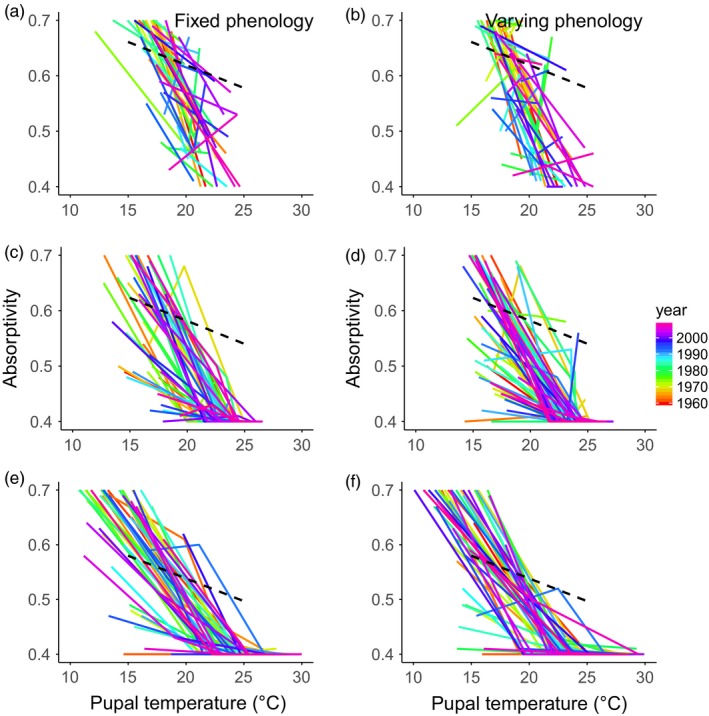
Figure 4.

Optimal reaction norms. Optimal reaction norms (optimal absorptivity as a function of mean pupal temperature in each generation) across years for the fixed (panels a, c, e) and variable (panels b, d, f) phenology for each elevation (top row = panels a–b: 3.0 km; middle row = c–d: 2.4 km; bottom row = e–f: 1.8 km). The observed reaction norm (dashed black line) is also included
