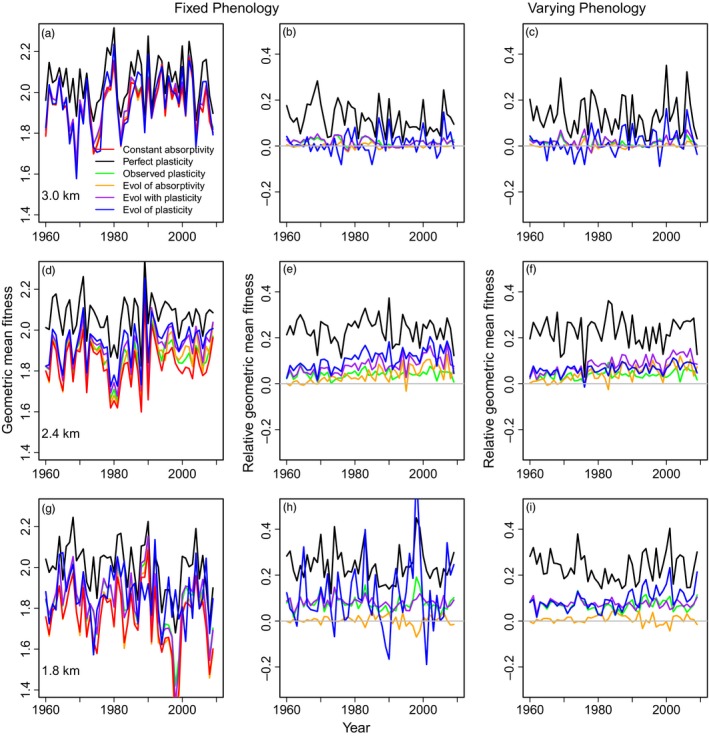
Figure 5.

Geometric mean population fitness as a function of year. The population fitness under fixed phenology for each site (top row = panels a–c: 3.0 km; middle row = d–f: 2.4 km; bottom row = g–i: 1.8 km) varies among scenarios (see methods and legend, left column). We additionally depict geometric mean fitness relative to the case of constant absorptivity for the cases of fixed phenology (panels b, e, h) and varying phenology (panels c, f, i)
