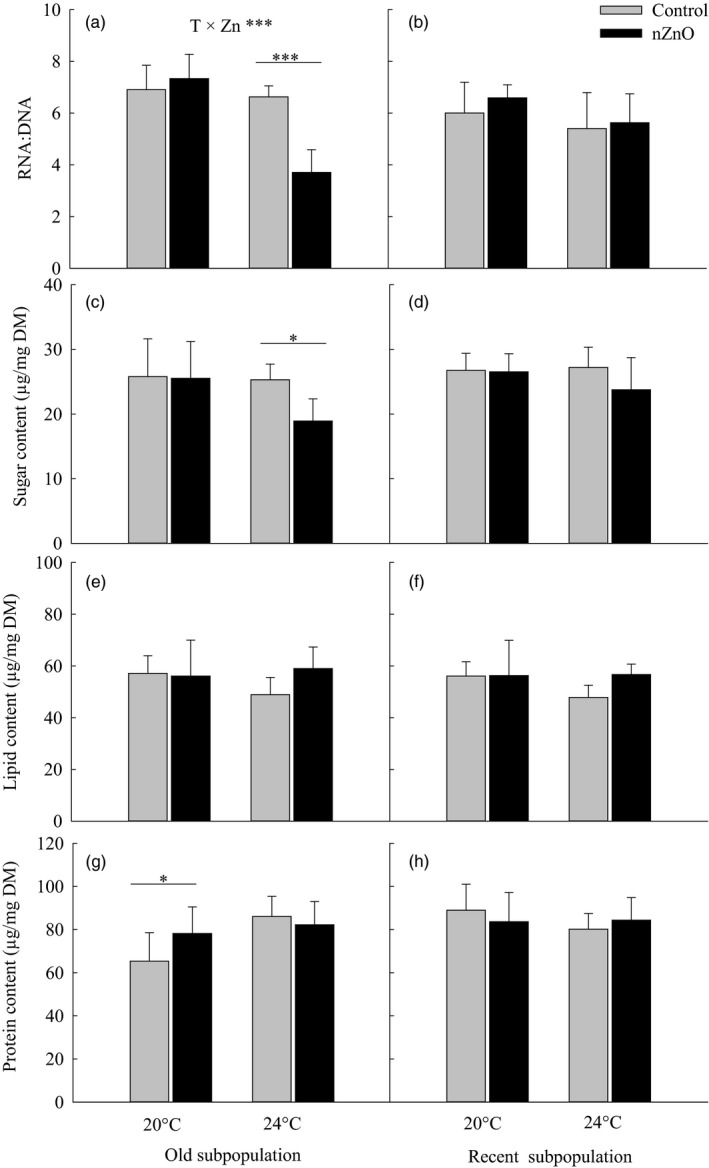
Figure 3.

RNA:DNA ratio (a,b), sugar content (c,d), lipid content (e,f), and protein content (g,h) as a function of nZnO and temperature in the old and recent subpopulations of Daphnia magna from Felbrigg Hall Lake. Given are least‐squares means + 1 SE based on seven clones per subpopulation. The asterisks indicate significant differences between the nZnO treatments levels within a given rearing temperature (*p < .05, **p < .01, ***p < .001). Significant Temperature × nZnO interactions are indicated per subpopulation based on separate two‐way ANOVAs
