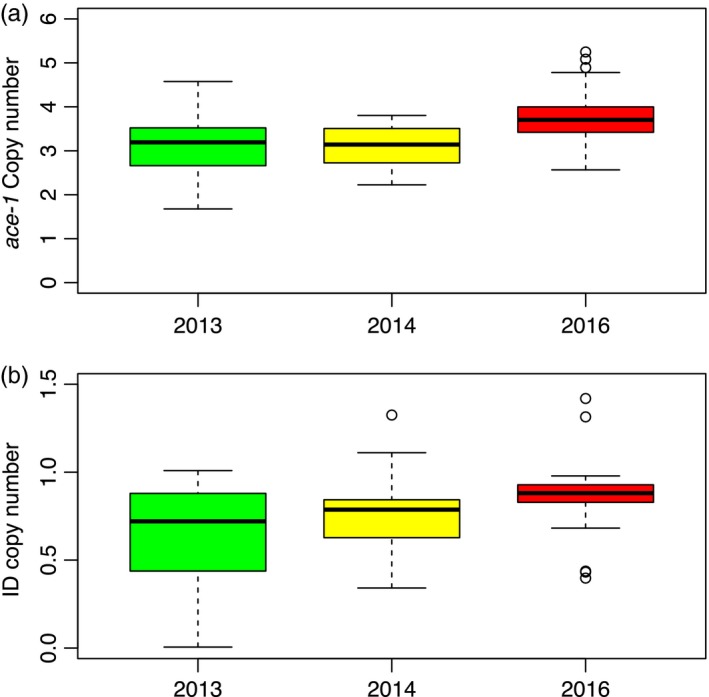
Figure 3.

Evolution of the number of ace‐1 and ID copies in [RR] individuals from Baguida (Togo). Box plot represents the distributions of the copy numbers ([a] ace‐1, [b] ID) in individuals sampled in Baguida in 2013, 2014, and 2016. The bold line represents the median, the box and whiskers, respectively, represent the 25% and 75%, and 5% and 95% quartiles, and the dots represent outliers
