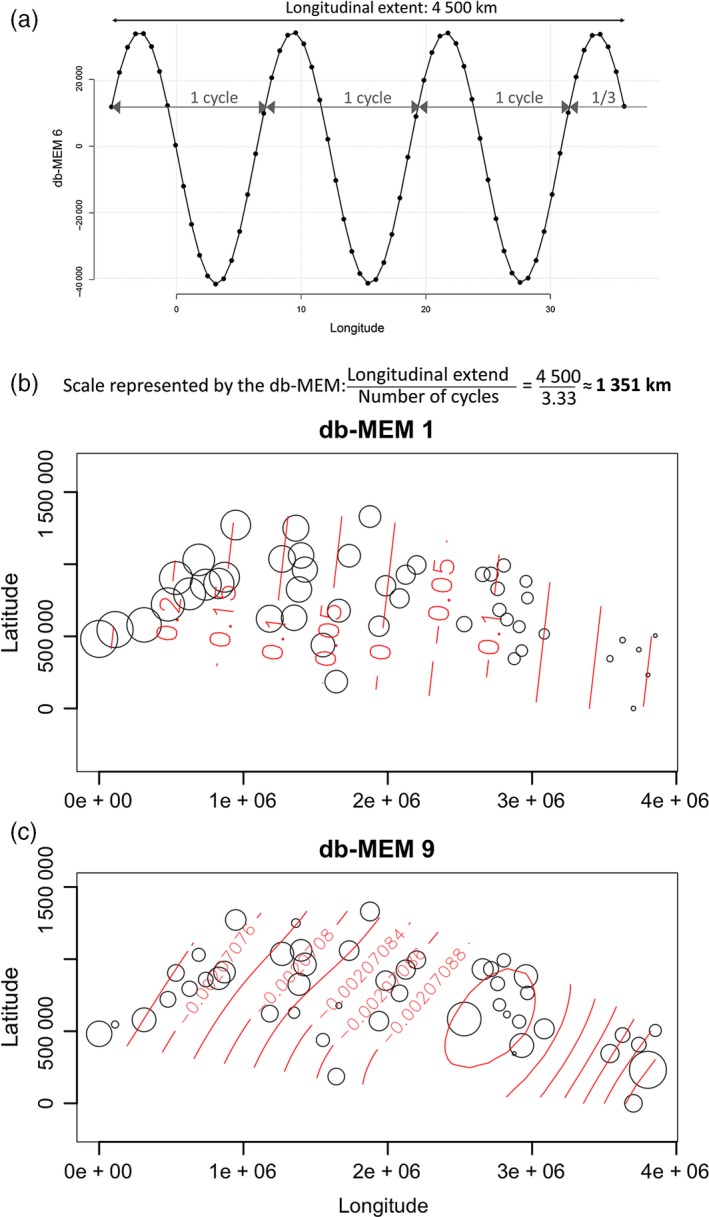
Figure 3.

Coordinates of the sampling sites on db‐MEMs and the spatial scale they represent. (a) Theoretical system illustrating how to calculate the scale represented by db‐MEMs. The system covers the same longitudinal extent as our study area (4,500 km) and is constructed from 63 sampling points spaced by an equal distance (the smallest distance between our sampling sites—47 km). The graph presents the coordinates of these sites on the sixth theoretical db‐MEM. The scale represented by the vector is the ratio of the longitudinal extent to the number of cycles of the sinusoid. (b,c) Bubble plots illustrating the db‐MEMs 1 (b) and 9 (c) corresponding to the potential spatial scales of variability based on the geographic distances among sites. The size of the bubble reflects the coordinate of the site on the db‐MEM. Contour lines (in red) show the db‐MEM scores. The bubble plots have been created using the “ordisurf” function of the “vegan” R package version 2.4‐6 (Oksanen et al., 2016)
