Figure 4.

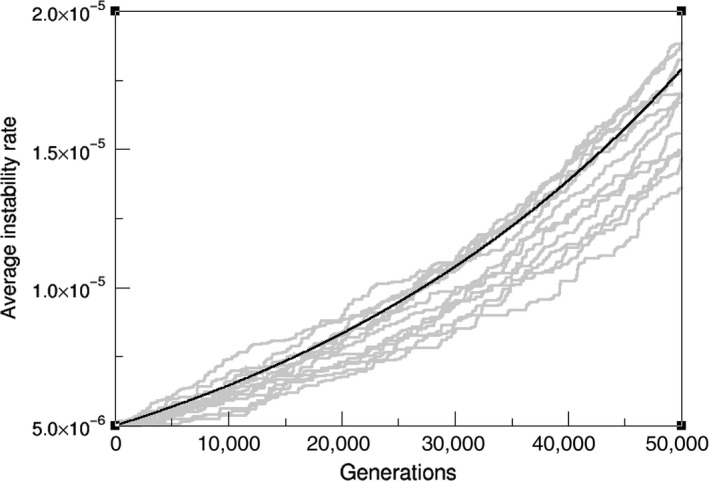
Exponential evolution of the mean mutation probability on a linear landscape: Moran process simulations (grey lines) of populations of 2,000 cells and the AD approximation (black curve), (σ = 0.01, μ0 = 5 × 10⁻⁶)

Exponential evolution of the mean mutation probability on a linear landscape: Moran process simulations (grey lines) of populations of 2,000 cells and the AD approximation (black curve), (σ = 0.01, μ0 = 5 × 10⁻⁶)