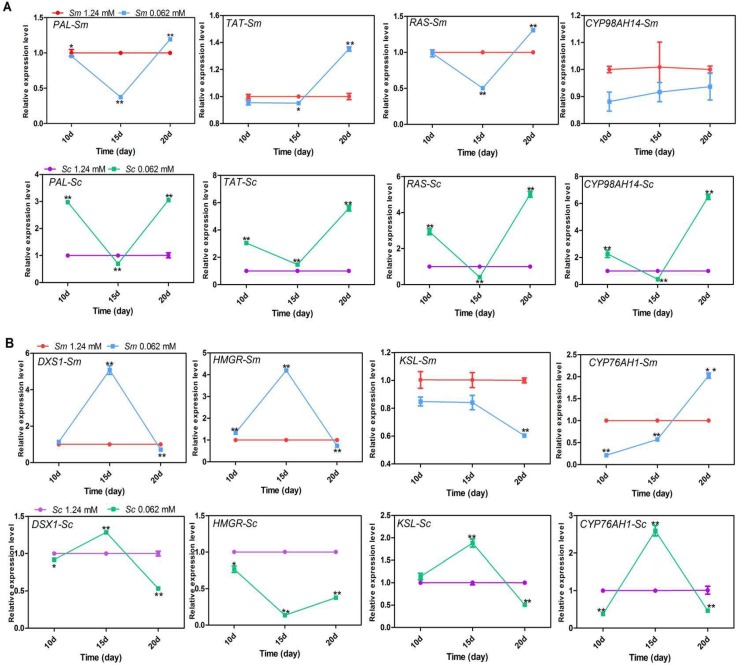
Figure 3.
Quantification of the transcript levels of key enzyme genes in hairy roots under control and Pi-deficient conditions at different times (10th, 15th, 20th day). Quantification of the transcript levels of key enzyme genes were calculated in relation to β-actin reference gene transcript levels. (A) Genes involved in phenolic acid biosynthesis. (B) Genes involved in tanshinone biosynthesis. Sm, S. miltiorrhiza; Sc, S. castanea; PAL, phenylalanine ammonia lyase; TAT, tyrosine aminotransferase; RAS, rosmarinic acid synthase; CYP98A14, cytochrome P450-dependent monooxygenase; DXS1, 1-deoxy-d-xylulose 5-phosphate 1; HMGR, 3-hydroxy-3-methylglutary CoA reductase; KSL, kaurene synthase-like; CYP76AH1, cytochrome P450-dependent monooxygenase. The asterisk “*”represents 0.01 < p < 0.05; asterisks “**”represents p < 0.01 compared to the control phosphate value and obtained via Student’s t-test by SPSS.

