Fig. 6.
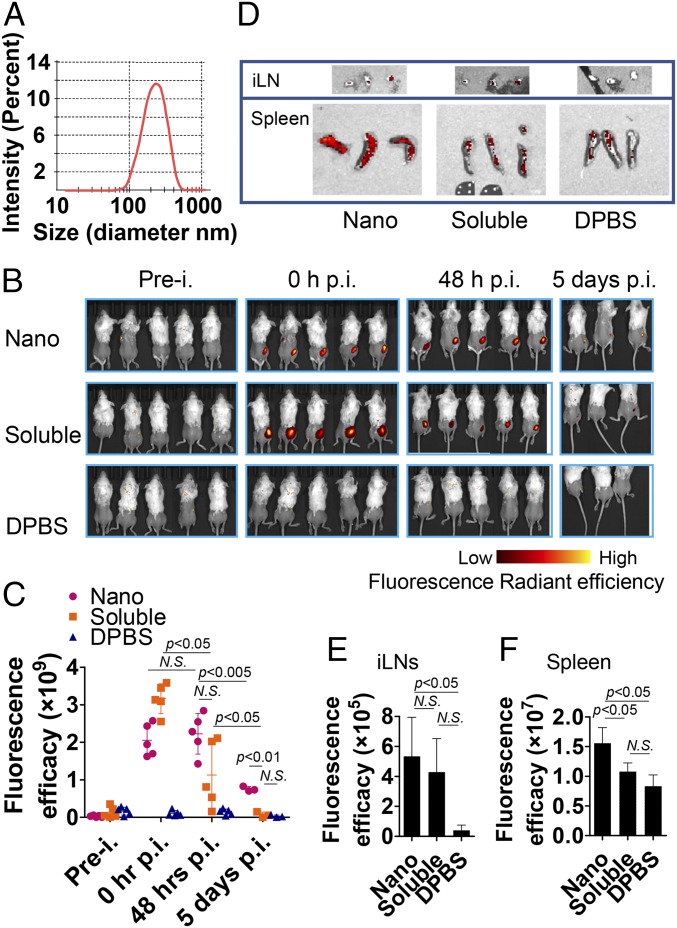
In vivo visualization in mice. (A) Size distribution of fluorescent H7 nanoparticle. (B) Biodistributions of IM injected Alexa Fluor 700 succinimidyl ester dye-conjugated fluorescent H7 nanoparticle and fluorescent soluble H7 protein were analyzed in vivo using Perkin-Elmer IVIS Spectrum In Vivo Imaging System at the following time points: preinjection (prei.), 0-h postinjection (hpi), 48 hpi, and 5 dpi. Mice injected with DPBS were used as negative controls. (C) Fluorescence radiant efficiency in vivo was quantified at the indicated four time-points in B using Living Image software. (D) Biodistributions of fluorescent H7 nanoparticle and fluorescent soluble H7 protein in iLN and spleens were analyzed at 8 dpi. The iLN and spleens isolated from DPBS-injected mice were used as negative controls. Fluorescent radiant efficiency in (E) iLN and (F) spleens were quantified 8 dpi using Living Image software. Data are presented as mean ± SD. Statistical significance was analyzed by two-way ANOVA for C and by t test for E and F P values shown in bar charts and N.S. indicates no significance between two compared groups.

