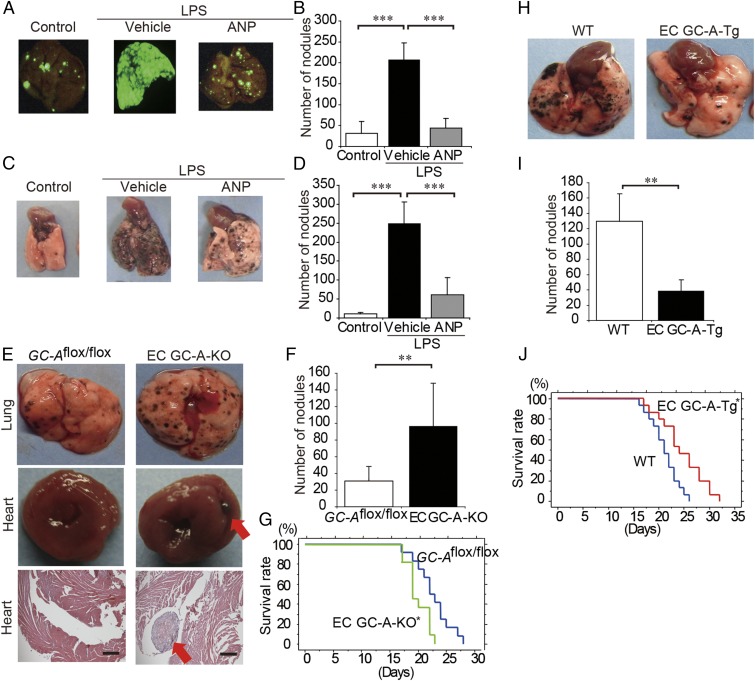
Fig. 2.
ANP inhibits the LPS-augmented metastasis of A549-EGFP lung cancer cells and B16/F10 mice melanoma cells to the lung. (A) Representative EGFP images of the lungs of mice that were pretreated with or without LPS and then injected with A549-EGFP cells (1 × 10⁶ cells per mouse) and continuously treated with or without ANP for 4 wk. The mice were killed 6 wk after the injection of tumor cells. (B) Bar graph showing the number of nodules representing pulmonary metastasis of A549-EGFP cells in mice grouped as in A. Data are means ± SD (n = 6, each group). ***P < 0.001, unpaired two-tailed t test. (C) Representative images of the lungs of mice that were pretreated with or without LPS and then injected with B16/F10 cells (2 × 10⁵ cells per mouse) and continuously treated with or without ANP for 2 wk. The mice were killed 2 wk after the injection of the tumor cells. (D) Bar graph showing the number of nodules representing pulmonary metastasis of B16/F10 cells in mice grouped as in C. Data are means ± SD (n = 6, each group). ***P < 0.001, unpaired two-tailed t test. (E) Representative images of the lungs and hearts (Top and Middle, respectively) and histological cross-sections of the hearts (H&E staining, Bottom) of the GC-Aflox/flox mice and EC GC-A-KO mice after injection of B16/F10 cells (2 × 10⁵ cells per mouse). The mice were killed 2 wk after the injection of the tumor cells. (Scale bars, 500 μm.) Red arrows indicate metastasis in the heart. (F) Bar graph showing the number of nodules representing pulmonary metastasis of B16/F10 cells in mice grouped as in E. Data are means ± SD (n = 9, 7, each group). **P < 0.01, unpaired two-tailed t test. (G) Kaplan–Meier curves comparing survival times between GC-Aflox/flox and EC GC-A-KO mice after injection of B16/F10 cells (2 × 10⁵ cells per mouse). n = 12, 11 (each group), *P < 0.05, log-rank test. (H) Representative images of the lungs of WT and EC GC-A-Tg mice after injection of B16/F10 cells (5 × 10⁵ cells per mouse). The mice were killed 2 wk after the injection of tumor cells. (I) Bar graph showing the number of nodules representing pulmonary metastasis of B16/F10 cells in mice grouped as in H. Data are means ± SD (n = 10, 8, each group). **P < 0.01, unpaired two-tailed t test. (J) Kaplan–Meier curves comparing survival times between WT and EC GC-A-Tg mice after injection of B16/F10 (5 × 10⁵ cells per mouse). n = 15 (each group), *P < 0.05, log-rank test. Whole images of lungs were shown in SI Appendix, Fig. S1.

