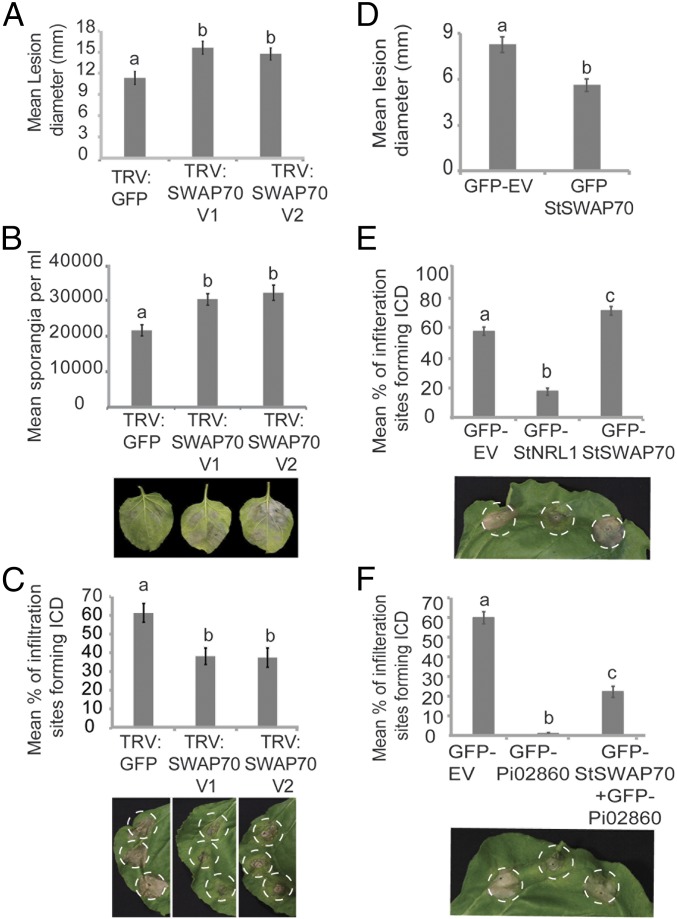
Fig. 2.
StSWAP70 is a positive regulator of immunity. (A) VIGS of NbSWAP70 enhances P. infestans leaf colonization. Graph shows increased P. infestans lesion sizes on plants expressing TRV:SWAP70 V1 or TRV:SWAP70 V2, compared with a TRV:GFP control (ANOVA, P < 0.002; n = 228). (B) Graph showing an increase in the average numbers of sporangia per milliliter recovered from infected leaves of plants expressing TRV:SWAP70 V1 or TRV:SWAP70 V2, compared with the TRV:GFP control plants (ANOVA, P < 0.001; n = 33). Example leaves below the graph show P. infestans lesion development on control, TRV:NRL1 V1, or TRV:NRL1 V2 plants. (C) SWAP70 VIGS results in a significant decrease in ICD in TRV:SWAP70 V1 and TRV:SWAP70 V2 plants compared with the TRV:GFP control at 6 dpi (ANOVA, P < 0.001; n = 55). Example leaves below the graph show INF1 cell death development on TRV:GFP control, TRV:NRL1 V1, or TRV:NRL1 V2 plants (left to right). (D) Overexpression of GFP-StSWAP70 significantly decreased P. infestans lesion size compared with the GFP control empty (GFP-EV) (ANOVA, P < 0.001; n = 155). (E) Transient overexpression of GFP-StSWAP70 in N. benthamiana accelerates ICD (ANOVA, P < 0.001; n = 56) compared with free GFP or GFP-StNRL1. Representative leaf image below the graph shows ICD following overexpression of each construct, as indicated, in N. benthamiana. (F) The transient overexpression of StSWAP70 reduces Pi02860 suppression of ICD (ANOVA, P < 0.001; n = 56). Below the graph is a representative leaf image showing ICD following overexpression of each construct, as indicated, in N. benthamiana. The results shown in A to F are combinations of at least five individual biological replicates and error bars show ±SE. Letters on the graphs denote statistically significant differences (ANOVA).

