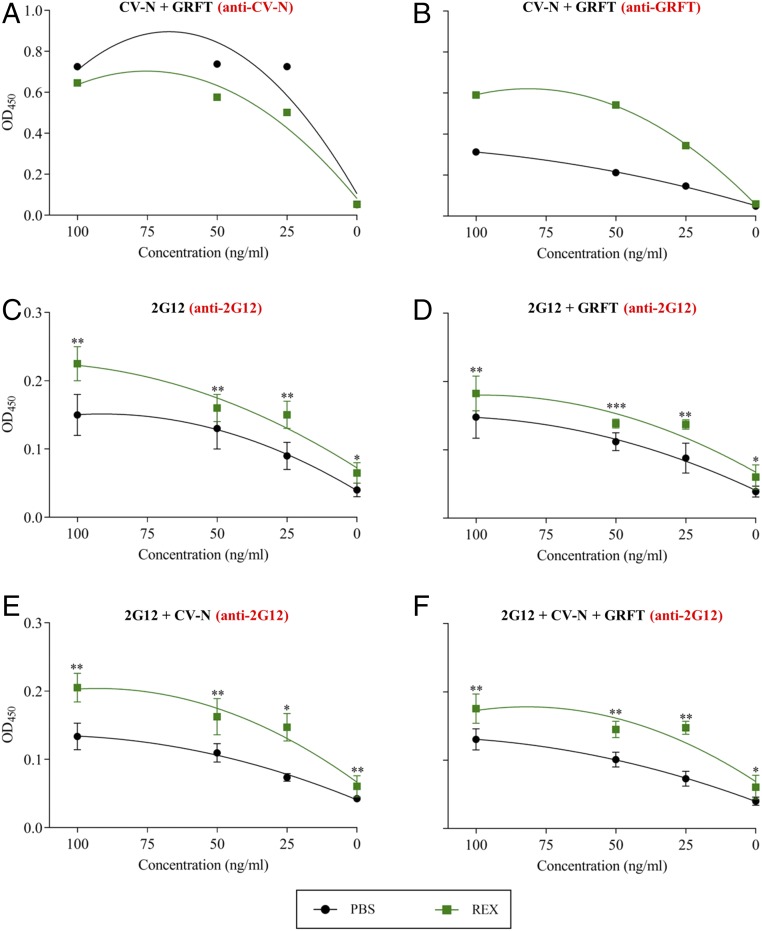
Fig. 1.
ELISA experiments to determine gp120-binding activity. (A and B) GRFT and CV-N reconstituted in PBS or crude rice endosperm extract (REX) detected with a CV-N–specific antibody (A) or a GRFT-specific antibody (B). (C–F) 2G12 detected with an Ig-specific antibody: 2G12 in PBS or REX alone (C); 2G12 + GRFT (D); 2G12 + CV-N (E); and 2G12 + GRFT and CV-N (F). In all panels, the concentrations on the x axis refer to all components in the assay, i.e., all components were present at the same concentrations in all assays. This was appropriate because competition experiments established that the components do not interfere with each other’s ability to bind gp120 at any of the tested concentrations (SI Appendix, Fig. S1). Data are presented as a fitted quadratic regression model to compare the different curve parameters and establish significant differences between PBS and REX. No statistical differences were found for A and B (P > 0.05). Asterisks represent statistically significant differences (ANOVA) at different concentrations of the three components (***P < 0.001, **P < 0.01, *P < 0.05). Error bars indicate the SEM from three replicates.

