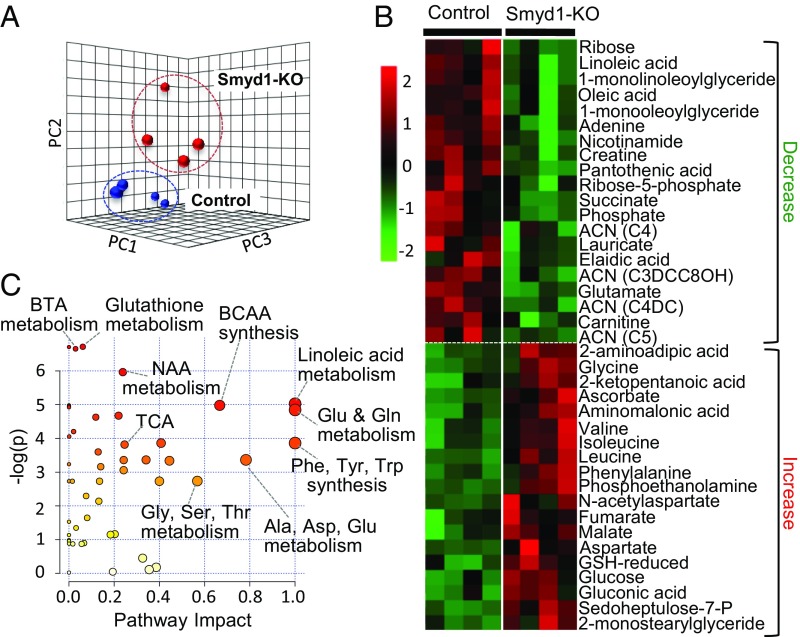
Fig. 2.
Metabolomic profile of Smyd1-KO mice at week 3 of tamoxifen diet. Metabolomic analysis was performed on left ventricle tissue from Smyd1-KO mice and age-matched control mice at week 3 of tamoxifen diet (n = 4 for Smyd1-KO mice and n = 4 for control mice), using GC/MS and MS/MS. (A) PCA of all 147 metabolites clearly separates the profiles of Smyd1-KO (red) and control (blue) mice. (B) The heat map represents all metabolites significantly altered in Smyd1-KO mice (20 decreased; 19 increased; P < 0.05). (C) Impact Pathway Analysis contains all the matched pathways (the metabolome) arranged by P values (from pathway enrichment analysis) on the y axis and pathway impact values (from pathway topology analysis) on the x axis. The node color is based on its P value, and the node radius is determined based on their pathway impact values. ACN, acylcarnitine; BCAA, branched-chain amino acid; BTA, butyric acid; GSH, glutathione; NAA, N-acetyl-l-aspartate; Sedoheptulose-7-P, sedoheptulose-7-phosphate; TCA, tricarboxylic acid cycle.

