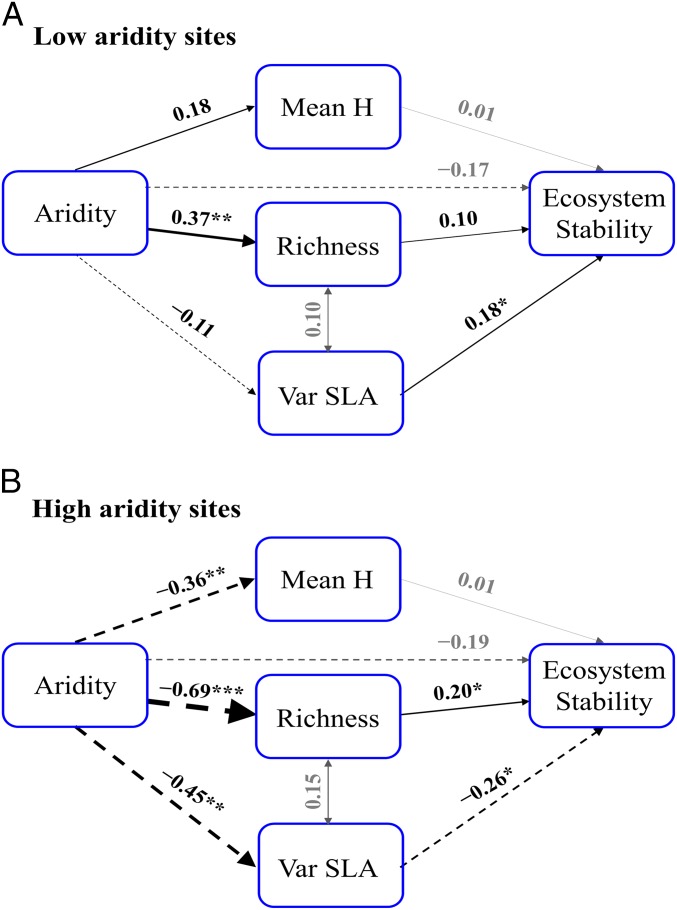
Fig. 3.
Relationships between aridity, facets of plant diversity, and residual variance of ecosystem stability in sites with low (A; <0.6) and high (B; >0.6) aridity levels. Before feeding into the SEM, the residual variance of ecosystem stability was calculated by accounting for spatial, climatic, and soil variables. Such residual variance represents 46% and 29% of the original ecosystem stability in the low and high aridity sites, respectively. The weight of the arrows indicates the strength of the causal relationship, supplemented by a path coefficient. Double-headed arrows indicate correlations. Black arrows indicate relationships that are statistically different (P < 0.05) between the two aridity levels (statistical details are provided in SI Appendix, Table S3). Gray arrows indicate relationships that are not statistically different between the two aridity levels. Continuous and dashed arrows indicate positive and negative relationships, respectively. Goodness-of-fit tests for multigroup comparisons: χ2 = 4.43, P = 0.359; GFI = 0.976, RMSEA = 0.029, P = 0.556. *P < 0.05; **P < 0.01; ***P < 0.001. R2 values for residual variance of ecosystem stability are 0.07 in the low aridity sites and 0.11 in the high aridity sites (n = 61 and n = 62 in the low and high aridity models, respectively). Var, variance.

