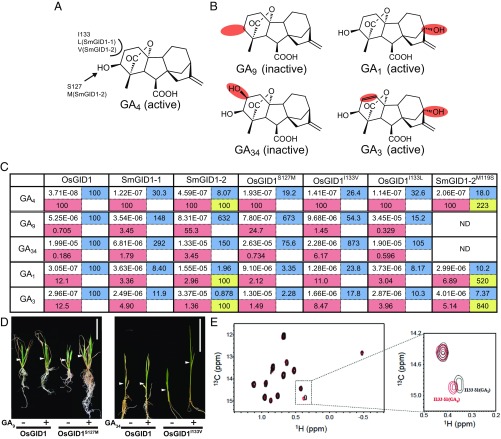
Fig. 2.
Interaction affinities of GID1s to GAs. (A) Structure of GA4 with the amino acids featured in Fig. 1. I133 and S127 of OsGID1 interacting with the C3-OH and C2 positions of GA4 were replaced with the corresponding residues of SmGID1s. (B) Structures of GA9, GA1, GA34, and GA3, with sites distinct from those in GA4 marked in red. (C) Interaction affinity between indicated GID1s and five GAs as measured by SPR. All values are represented as molar concentration (M). The relative affinities of various GID1s relative to WT-OsGID1 are presented in the right, blue cell, whereas those of various GAs to GA4 are in the lower, red cell. The affinity of SmGID1-2M119S relative to WT-SmGID1-2 is presented in the lower right, yellow cell. ND, no data. (D) Effects of GA9 and GA34 on shoot elongation in rice plants overproducing GID1S127M and GID1I133V, respectively. (Scale bars: 5 cm.) (E) Comparison of the HSQC spectrum of [13Cδ1H3]-Ile–labeled OsGID1 carrying GA4 (red) or GA1 (black) with that of interaction with SLR1. The dotted square in the Left is enlarged in the Right.

