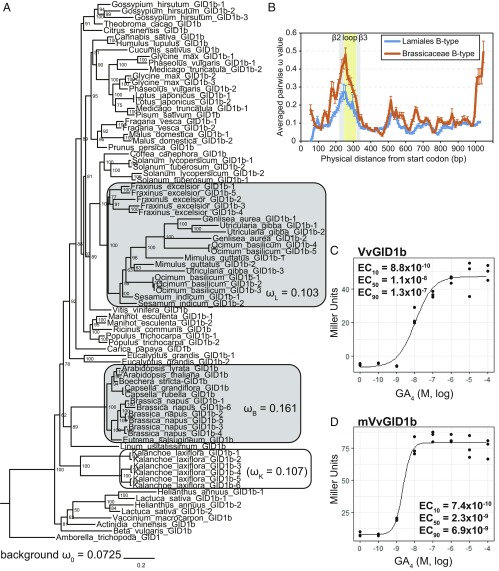
Fig. 4.
Diversification of GID1s. (A) Phylogenetic analysis of B-type GID1s based on the alignment presented in Dataset S4. The ω values (dN/dS) calculated by using the codeml branch model (26) for background, Lamiales, Brassicaceae, and K. laxiflora, according to model Three (background, Lamiales, Brassicaceae) and model Two′ (K. laxiflora) (SI Appendix, Tables S1 and S2). Branch nodes show posterior probability. Horizontal branch lengths are proportional to the estimated number of amino acid substitutions per residue. A. trichopoda GID1 was used as an out-group. (B) The ω sliding window analysis of B-type GID1s in Brassicaceae and Lamiales using windows of 100 nucleotides with 10-bp step size. Error bars indicate SE. (C and D) Quantitative β-galactosidase assay for GA4 dose-dependence of the interactions of VvGID1 or mVvGID1b with A. thaliana GAI in Y2H. mVvGID1b. The loop region of VvGID1b (normal) was replaced with that of GmGID1b-2 (hypersensitive). β-Galactosidase activity was quantified in terms of Miller units by liquid assay. The 10%, 50%, and 90% of the maximum effective concentration (M) of GA4 (EC10, EC50, EC90) are shown in the graph. n = 3.

