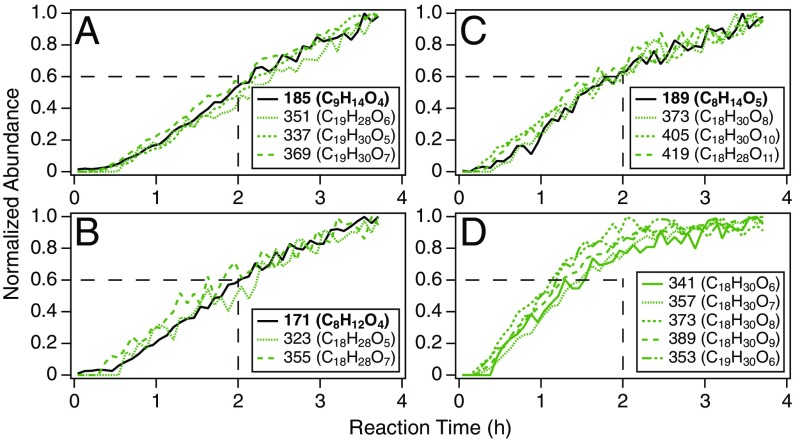
Fig. 4.
Temporal profiles of molecular products in SOA produced from the O3-initiated oxidation of β-pinene in the CTEC (SI Appendix, Table S1, Exp. 1), measured by PILS + UPLC/(−)ESI-Q-TOF-MS. Profiles are plotted as the particle-phase abundance of each species, normalized to the highest abundance observed over 4 h of reaction, as a function of reaction time. Discrete data points (5-min resolution) are presented as lines to aid the eye. Numbers correspond to nominal m/z values of [M−H]− ions; molecular formulas are given in parentheses. (A–C) Profiles of dimer esters (Table 1, type 1) and dicarboxylic acids implicated as precursors based on MS/MS analysis: (A) cis-pinic acid (m/z 185; C9H14O4; RT 4.33), (B) cis-norpinic acid (m/z 171; C8H12O4; RT 4.06), and (C) diaterpenylic acid (m/z 189; C8H14O5; RT 3.32). (D) Profiles of dimers (Table 1, type 2) characterized by almost immediate formation and rapid particle-phase growth. Dashed lines (2 h, 0.6 abundance) are drawn to aid in comparison between growth profiles in A–C and D.

