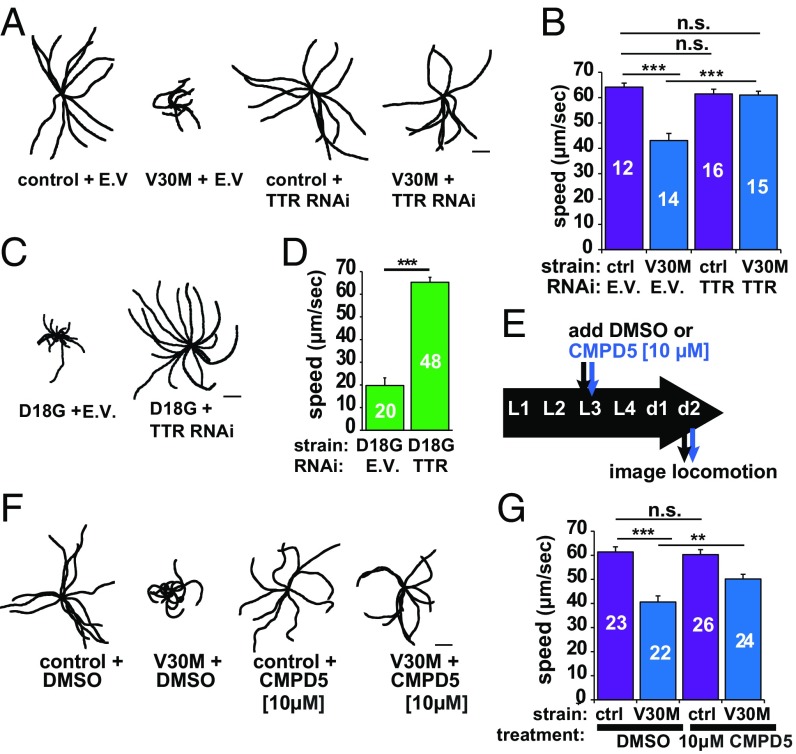
Fig. 7.
Reduction or stabilization of TTR levels improves TTR-mediated locomotion impairments. (A) Representative 40-s locomotion trajectories of adult day-1 animals quantified in B. The starting points for each trajectory were aligned in the middle. (B) Comparison of locomotion rates in the indicated strains. The number of animals analyzed is shown inside the bars. See also SI Appendix, Fig. S11. (C) Representative 40-s locomotion trajectories of the indicated strains. (D) Locomotion rates of the animals plotted in C. (E) Schematic of the timeline for the locomotion and CMPD5 treatment assay. (F) Representative 40-s trajectories of the indicated strains. (G) Locomotion rates for 2-d-old strains plotted in F. Plots show mean ± SEM, **P < 0.005, ***P < 0.001, by Student’s t test. E.V., empty vector; n.s., not significant. (Scale bars: 2 mm.)

