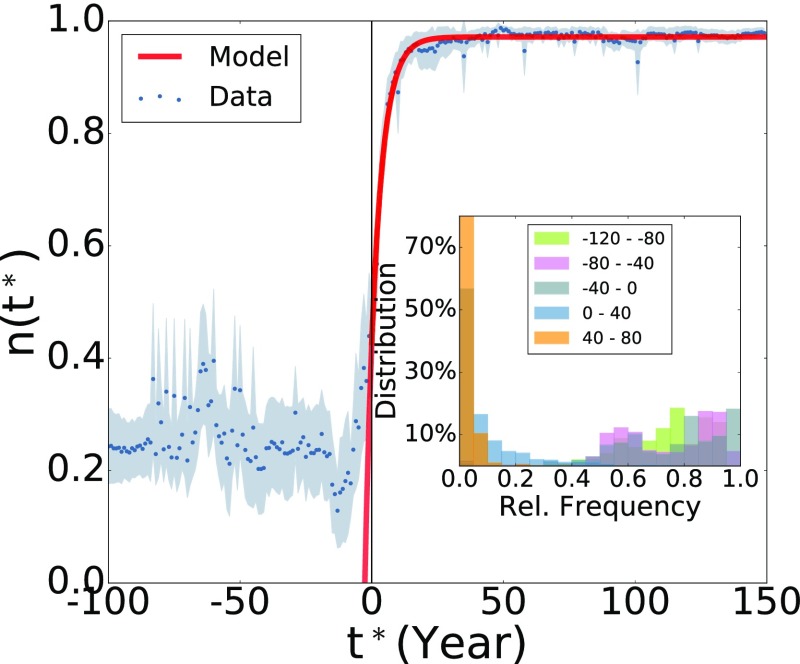
Fig. 2.
Regulation by a formal institution (Spanish, RAE). Relative (Rel.) frequency of the new spelling form as a function of the rescaled time is shown. Blue points represent the average over all of the considered pairs of words, and the gray area shows the SD of the data. The solid line is the prediction of the model outcome (Eq. 2) after parameter fit (, ). The black vertical line denotes the rescaled regulation year = 0. (Inset) Frequency histogram of the old spelling form for all pairs of word forms, for different time periods (negative time refers to periods before the regulation).

