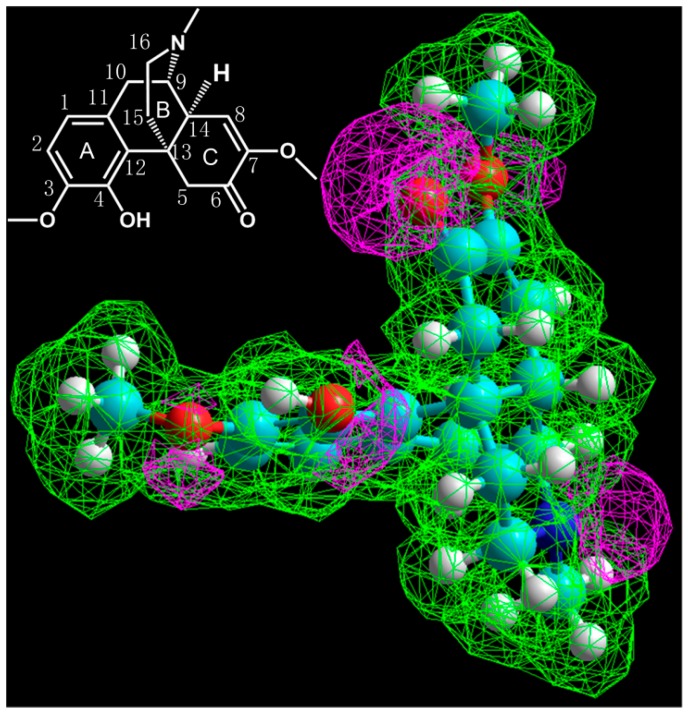
Figure 2.
The electrostatic potential plot of the compound model optimized by semi-empirical method, AM1. Purple indicates negative potential while green indicates positive potential. The sites with negative potential were amine group, carbonyl group, hydroxyl group, and ether groups where the initial protonation could happen most likely.

