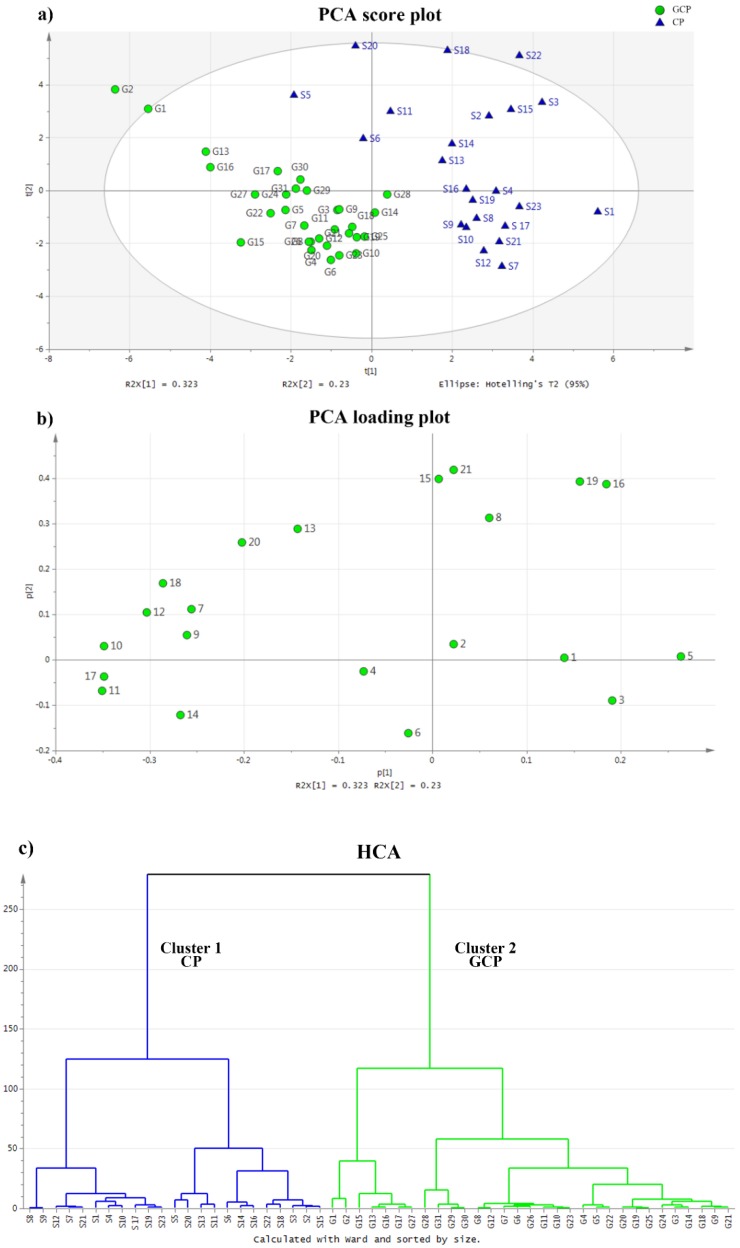
Figure 2.
Multivariate data analysis of Citri reticulatae pericarpium (CRP). (a) Score plot of the principal-component-analysis (PCA) result. The variances accounted by the first principal component (PC1) and the second principal component (PC2) were 32.3% and 23.0%, respectively. Circles represent “Guangchenpi” (GCP) samples, and triangles represent CP samples. (b) Loading plot of the PCA result (PC1 vs. PC2). (c) Dendrograms of the hierarchical-cluster-analysis (HCA) result.

