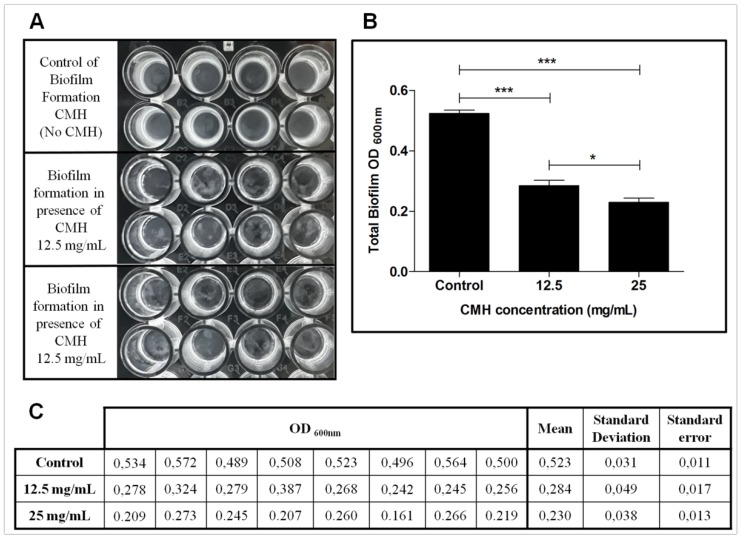
Figure 4.
Effect of CMH on MRSA-S. aureus biofilm formation. (A) Representative biofilm formation at different concentration of CMH (12.5 and 25 mg/mL) and control. (B) Quantification of total biofilm formed in presence or absence of CMH. Absorbance determined at 600 nm. (C) CMH effect on MRSA biofilm formation determined by absorbance measurement at 600 nm. Mean, standard deviation and standard error are represented. Statistical differences (* p < 0.05, ** p < 0.001, *** p < 0.0001) are represented by asterisks (ns = not significant).

