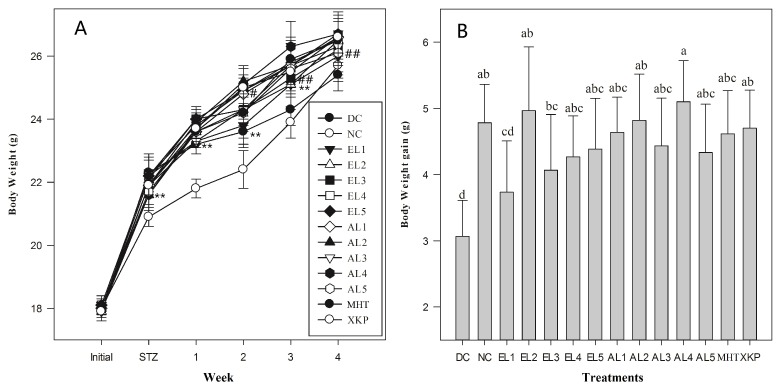
Figure 3.
(A) Changes in body weight of different groups (n = 6). (B) Body weight gain. DC: diabetic control group; NC: normal control group; EL1-EL5: STZ-induced diabetic mice treated with ethanol extracts from different locations; AL1-AL5: STZ-induced diabetic mice treated with aqueous extracts from different locations; MHT, XKP: positive controls, STZ-induced diabetic mice treated with Metformin Hydrochloride Tablets (MHT) and Xiaoke Pill (XKP), respectively. Values with different letters significantly differ at p < 0.05 by Duncan’s test. # p < 0.05 and ## p < 0.01 significance against the normal control group (NC). **p < 0.01 significance against the model control group (DC).

