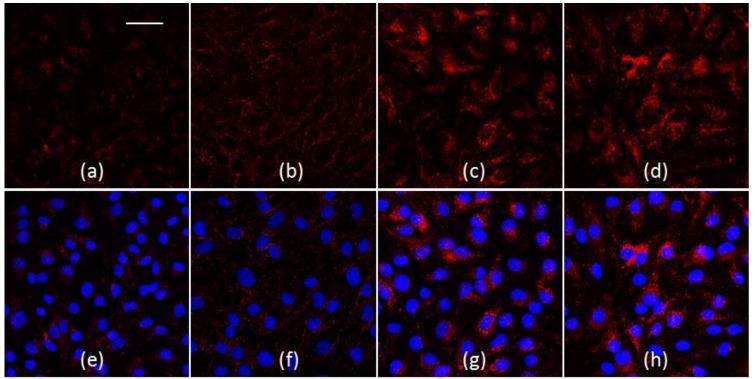
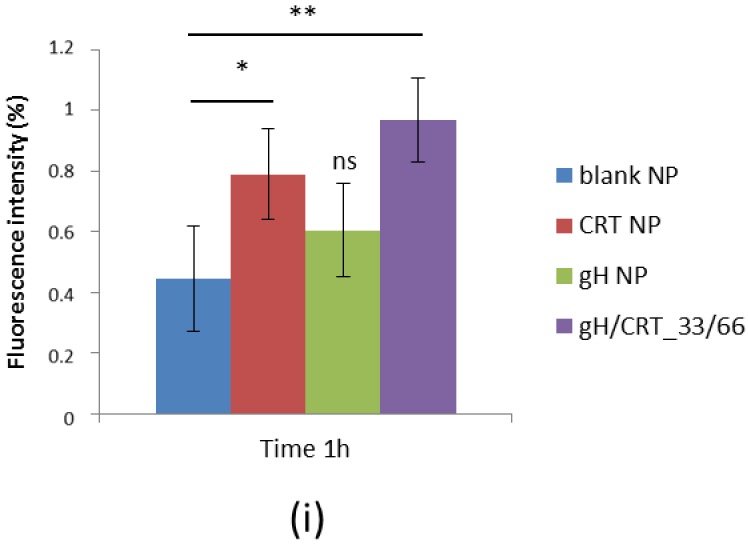
Figure 4.
(a–h) Confocal images of NPs in bEnd.3 after a 1-hour experiment in flow conditions. (a,e) blank NPs, (b,f) gH NPs, (c,g) CRT NPs, (d,h) gH/CRT_33/66. Red: NPs, blue: nuclei. Bar 50 µm. (i) Percentage of fluorescence intensity of NPs adherent to bEnd.3 layer after 1 h under flow condition (flow rate 10 µL/min). * p < 0.05, ** p < 0.0005; ns = not significant.


