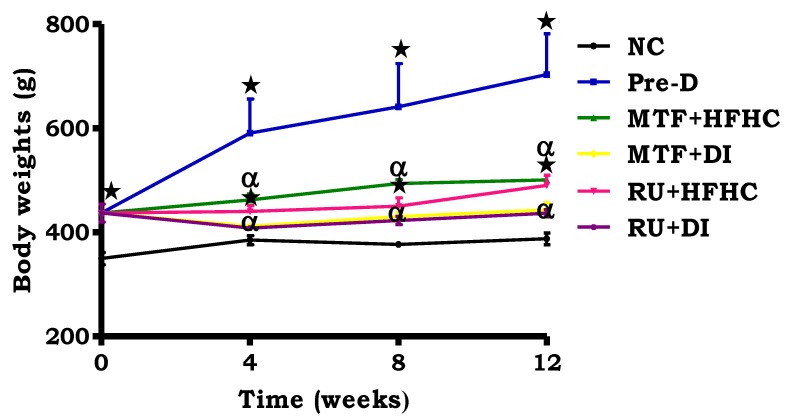
Figure 1.
The effects of the ruthenium complex on body weight of pre-diabetic animals during treatment period. Values are presented as means ± SEM (n = 6) in each group. * p < 0.05 by comparison with normal control (NC), α p < 0.05 by comparison with pre-diabetic control (Pre-D); Metformin and high fat high carbohydrate (MTF + HFHC); Metformin and diet intervention (MTF + DI); Ruthenium and high fat high carbohydrate (RU + MTF); and Ruthenium and diet intervention (RU + DI).

