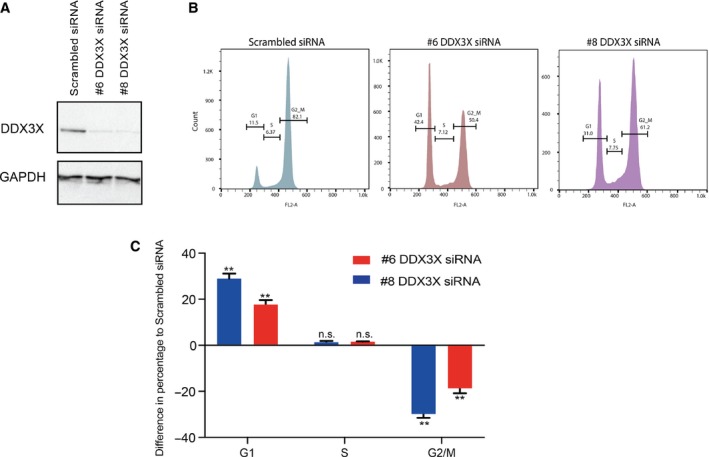
Figure 3.

DDX3X knockdown arrests MCF7 cells in G1 phase. MCF7 cell cycle progression flow cytometric analysis based on PI staining in MCF7 cells 72 h after transfection with either scrambled siRNA or one of two different siRNAs targeting DDX3X (#6 or #8). (A) Western blots showing protein levels of DDX3X and GAPDH in MCF7 cells transfected with scrambled siRNA or one of two different siRNAs targeting DDX3X (#6 or #8). (B) Representative images from FlowJo analysis of flow cytometric analysis of cell cycle progression upon PI staining (quantified in C). (C) Quantification of the data in B for each phase (G1‐S‐G2M) plotted as the difference in percentages for each DDX3X siRNA used to those of the scrambled siRNA values. Results represent the average of two replicates. P‐values represent statistical significance calculated with unpaired t test comparing to scrambled siRNA condition (P‐values: ns. >0.05; **≤0.01).
