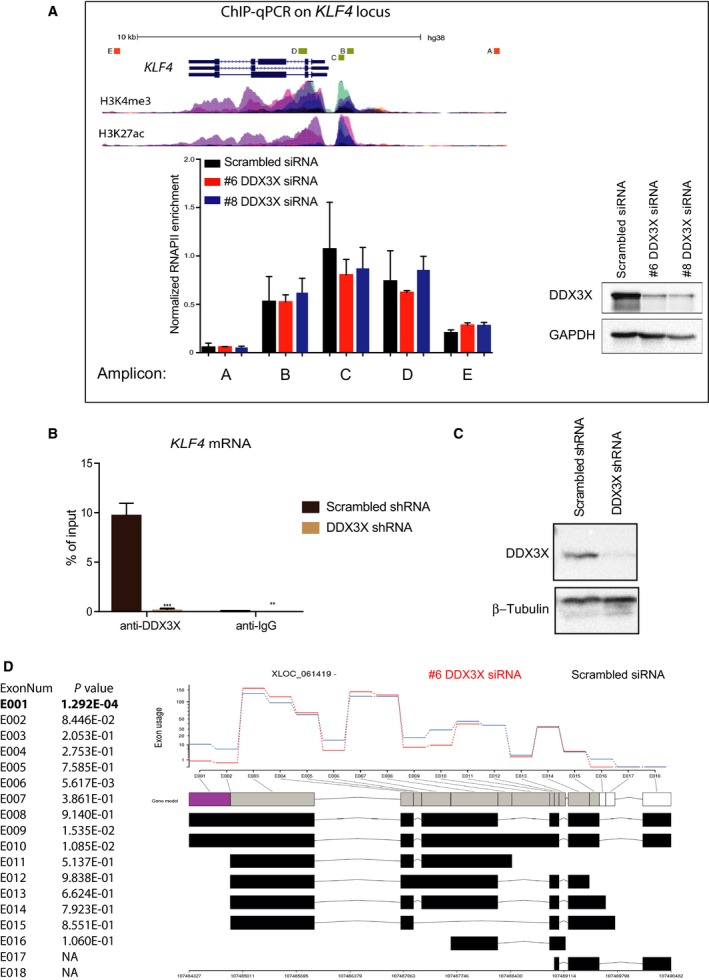
Figure 5.

DDX3X binds KLF4 mRNA and regulates its splicing. (A) Chromatin immunoprecipitation (ChIP)–qPCR analysis of RNA polymerase II (RNAPII) at the KLF4 gene in control (black bars) and DDX3X knockdown (red and blue bars) cells. ‘Normalized RNAPII enrichment’ ChIP efficiency calculated as a percentage of input normalized to the internal control for RNAPII occupancy, represented in this case by a GAPDH house‐keeping gene promoter region. A schematic representation of the KLF4 gene is shown (note: it is transcribed from right to left), and H3K4me3 and H3K27ac levels (from ENCODE) are included for reference purposes. The position of the amplicons analysed (A–E) are indicated. A western blot showing the levels of DDX3X in knockdown cells (#6 and #8 DDX3X siRNAs) is shown to the right. (B) CLIP‐qPCR was performed as described in Materials and methods with anti‐DDX3X and anti‐IgG antibodies in MCF7 cells transduced with either scrambled shRNA or DDX3X shRNA. RNA obtained from each immunoprecipitation was analysed by RT‐qPCR to determine enrichment of KLF4 mRNA. Results represent the average of three replicates. P‐values represent statistical significance calculated with unpaired t test comparing to scrambled shRNA condition (P‐values: ns. > 0.05; *≤0.05; **≤0.01; ***≤0.001). (C) Western blot showing the protein levels of DDX3X and β‐tubulin in MCF7 cells used in B. (D) Differential exon usage analysis in KLF4 mRNA upon DDX3X knockdown. Gene model colour code from purple to white indicates the descending statistical significance of the difference observed for each exon usage (purple: P‐value ≤5.0E‐4; grey box: P‐value >5.0E‐4; white box: N.A.). Analysis was obtained using DEXseq (Cut‐off P‐value ≤5.0E‐4); Top panel = normalized counts average of replicates for each sample; bottom panel = flattened gene model highlighting alternative annotated transcripts. (Red) Data from #6 DDX3X siRNA knockdown samples; (Blue) scrambled control. For each significant gene, all of the exons across all isoforms are labelled (E001, E002, etc.) and the ‘exon usage’ (essentially a normalized read count at that exon) is plotted for each of the conditions (averaged between the replicates). An exon (E001) that shows a significant difference between the conditions is highlighted in purple (P‐value ≤5.0E‐4).
