
Figure 3.
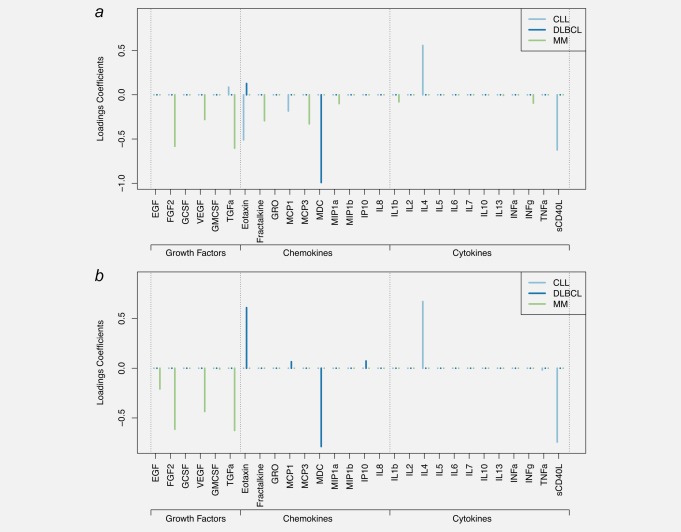
Results of the sparse PLS‐DA (sPLS‐DA) and sparse group PLS‐DA (sgPLS‐DA). Models were fitted on subtype‐specific sets of cases and controls. Loadings coefficients are presented for DLBCL, CLL and MM separately for the sPLS‐DA model (a), and the sgPLS‐DA (b) models. Models for FL are not reported as they yielded poor predictive performances. Abbreviations: IL, interleukin; INF‐α, interferon alpha; INF‐γ, interferon gamma; GMCSF, granulocyte–macrophage colony stimulating factor; TNF‐α, tumor necrosis factor alpha; EGF, epidermal growth factor; FGF‐2, fibroblast growth factor 2; GCSF, granulocyte colony‐stimulating factor; GRO, melanoma growth stimulatory activity/growth‐related oncogene; IP10, INF‐γ‐induced protein 10; MCP‐1, monocyte chemotactic protein‐1; MCP‐3, monocyte chemotactic protein‐3; MDC, macrophage derived chemokine; MIP‐1α, macrophage inflammatory protein 1 alpha; MIP‐1ß, macrophage Inflammatory Protein 1 beta; sCD40L, soluble CD40 ligand; VEGF, vascular endothelial growth factor; TGF‐α, transforming growth factor alpha. [Color figure can be viewed at http://wileyonlinelibrary.com]