
Figure 4.
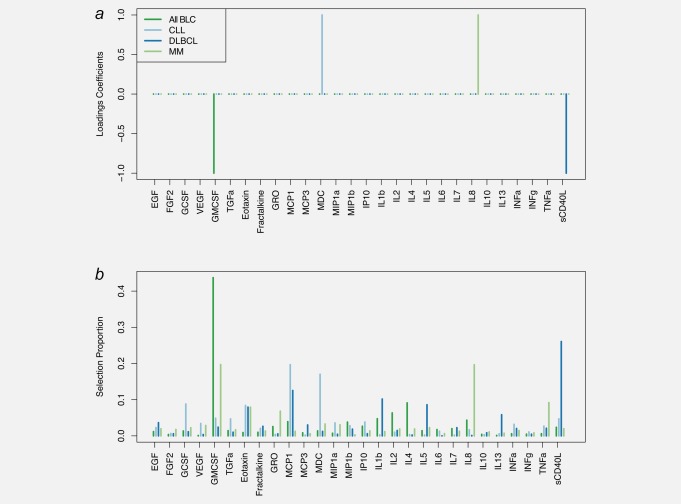
Results of the sparse PLS analyses of time to diagnosis in cases only. Results are presented for all BCL cases and for cases of DLBCL, CLL and MM separately. Loadings coefficients obtained for the calibrated models are presented for each set of cases considered (a). Results from stability analyses using 10,000 subsamples of the full set of cases are represented in B by the per‐variable proportion of selection across all independent subsamples. Abbreviations: IL, interleukin; INF‐α, interferon alpha; INF‐γ, interferon gamma; GMCSF, granulocyte–macrophage colony stimulating factor; TNF‐α, tumor necrosis factor alpha; EGF, epidermal growth factor; FGF‐2, fibroblast growth factor 2; GCSF, granulocyte colony‐stimulating factor; GRO, melanoma growth stimulatory activity/growth‐related oncogene; IP10, INF‐γ‐induced protein 10; MCP‐1, monocyte chemotactic protein‐1; MCP‐3, monocyte chemotactic protein‐3; MDC, macrophage derived chemokine; MIP‐1α, macrophage inflammatory protein 1 alpha; MIP‐1ß, macrophage inflammatory protein 1 beta; sCD40L, soluble CD40 ligand; VEGF, vascular endothelial growth factor; TGF‐α, transforming growth factor alpha. [Color figure can be viewed at http://wileyonlinelibrary.com]