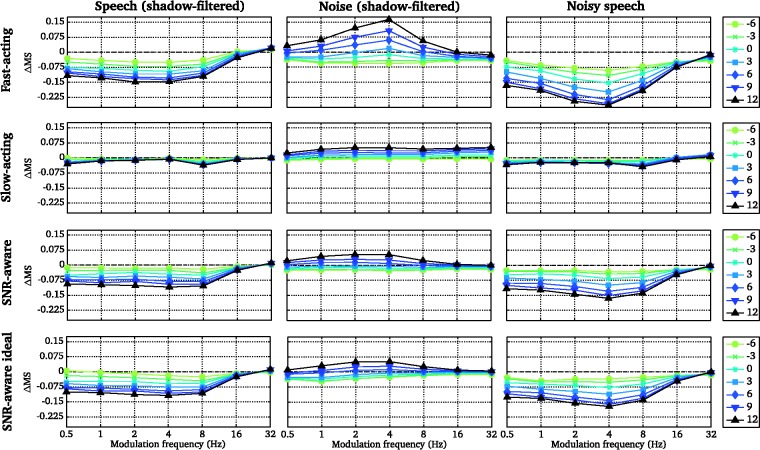
Figure 4.
Relative change in modulation spectra (ΔMS) caused by fast-acting (first row), slow-acting (second row), SNR-aware (third row), and ideal SNR-aware compression (fourth row) as a function of the modulation frequency and the input SNR. Results were averaged across all four noise types. The black dashed line indicates the zero line while the left, middle, and right columns show results for shadow-filtered speech, shadow-filtered noise, and noisy speech, respectively. SNR = signal-to-noise ratio.

