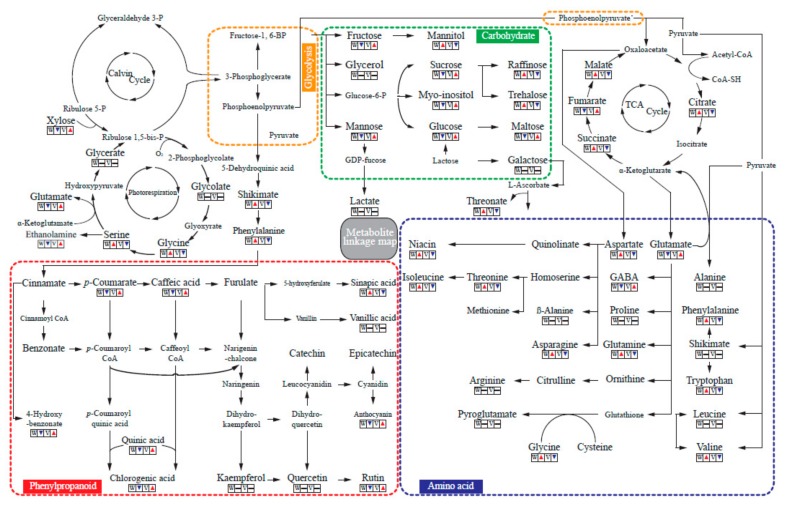
Figure 3.
A metabolic linkage map comparing primary and secondary metabolites of white flowers of M. denudata and violet flowers of M. liliiflora. The up arrow (▲) indicates a significantly higher mean value of the metabolite (at p < 0.05). The down arrow (▼) indicates a significantly lower mean value of the metabolite (at p < 0.05). The horizontal bar (–) indicates that no significant difference was found (at p < 0.05).

