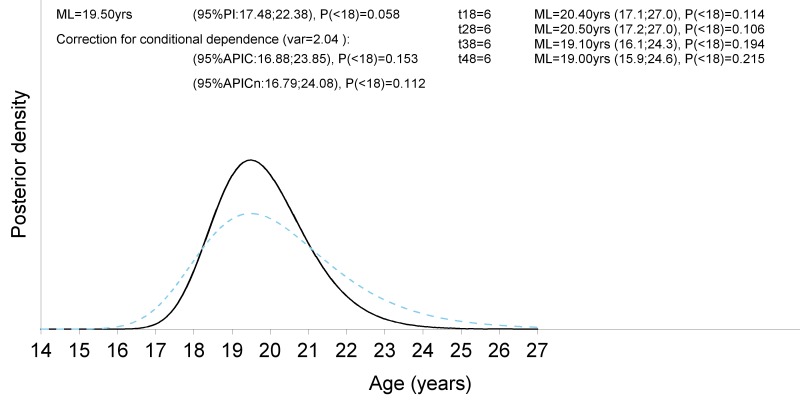
Figure 10.
Visualisation of the ad-hoc procedure to construct an approximate confidence interval without the need to model the multivariate correlation structure between the indicators. The black continuous curve refers to the posterior density assuming conditional independence. The blue dashed curve presents the density obtained after application of the ad-hoc procedure (Boldsen et al. 2002). At the top right are the stages for each third molar with their respective point prediction of age based on the maximum likelihood estimate, the 95% prediction interval and the posterior probability to be a minor. At the top left are the combined results, first without correction and second after correction applying the ad-hoc procedure. Note that without correction the prediction interval is too narrow.

