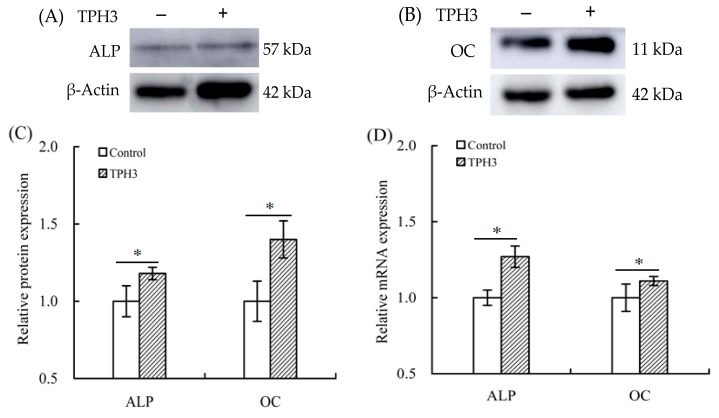
Figure 6.
Expression changes of alkaline phosphatase (ALP) and osteocalcin (OC) in the osteoblasts exposed to TPH3. The cells were treated with vehicle or TPH3 (0.05 g/L) for 7 (A) and 21 (B) d, respectively. Relative protein expression of ALP and OC (A,B); protein expression changes of ALP and OC (C), and relative mRNA expression changes of ALP and OC (D). Expression of genes and proteins were normalized against β-actin. *: compared to control, p < 0.05.

