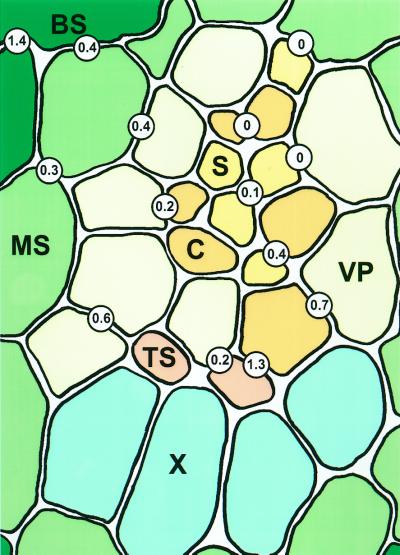
Figure 2.
Diagrammatic representation of plasmodesmatal frequencies in an intermediate vascular bundle of a sink barley leaf. Values are expressed as number of plasmodesmata per micrometer of shared wall interface. BS, Bundle sheath cell; C, companion cell; MS, mestome sheath cell; S, thin-walled sieve tube; TS, thick-walled sieve tube; X, xylem.

