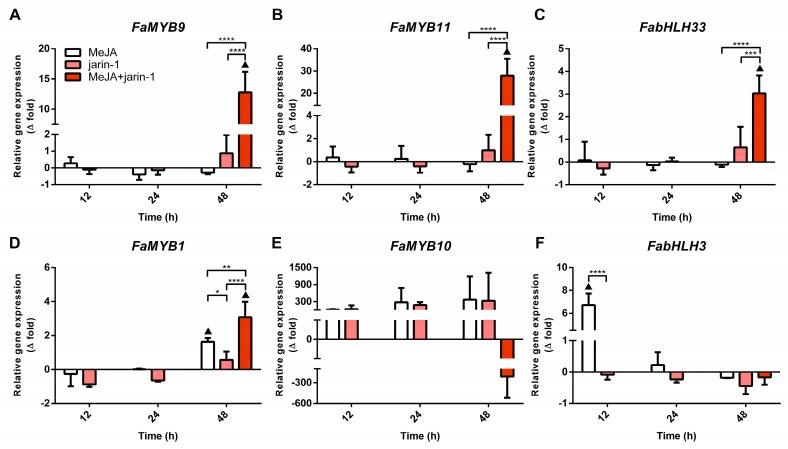
Figure 4.
Changes in relative expression levels of (A) FaMYB9, (B) FaMYB11, (C) FabHLH33, (D) FaMYB1, (E) FaMYB10, and (F) FabHLH3 at different time points under treatment compared to respective controls during the in vitro ripening of strawberry fruits. The expression data were determined by RT-qPCR and correspond to the mean of three biological replicates ± S.E normalized against controls. Differences between means were determined using two-way ANOVA and Tukey test. Asterisks indicate a significant difference (* p < 0.05, ** p < 0.01, *** p < 0.001, and **** p < 0.0001). Triangles (▲) above bars represent significant differences between treatments and their respective controls (p < 0.05).

