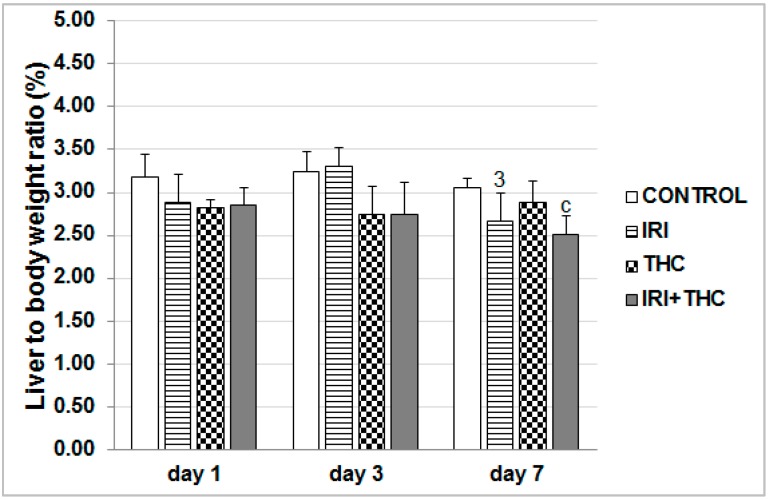
Figure 4.
Liver to body weight ratio in male Wistar rats after the 1-, 3-, and 7-day treatments with IRI, THC, their combination (IRI + THC), and in the respective controls. Values are expressed as mean ± SD (n = 5). Significantly different (p < 0.05; ANOVA, post hoc Tukey HSD test) values were c: vs. control; 3: vs. 3-day treatment.

