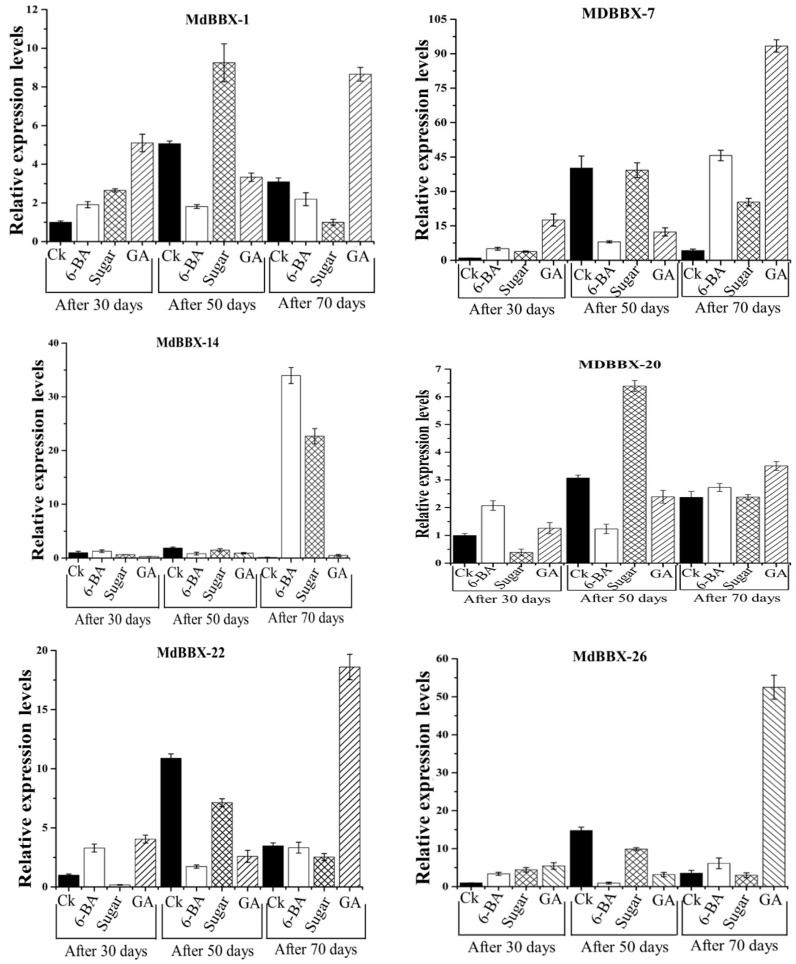
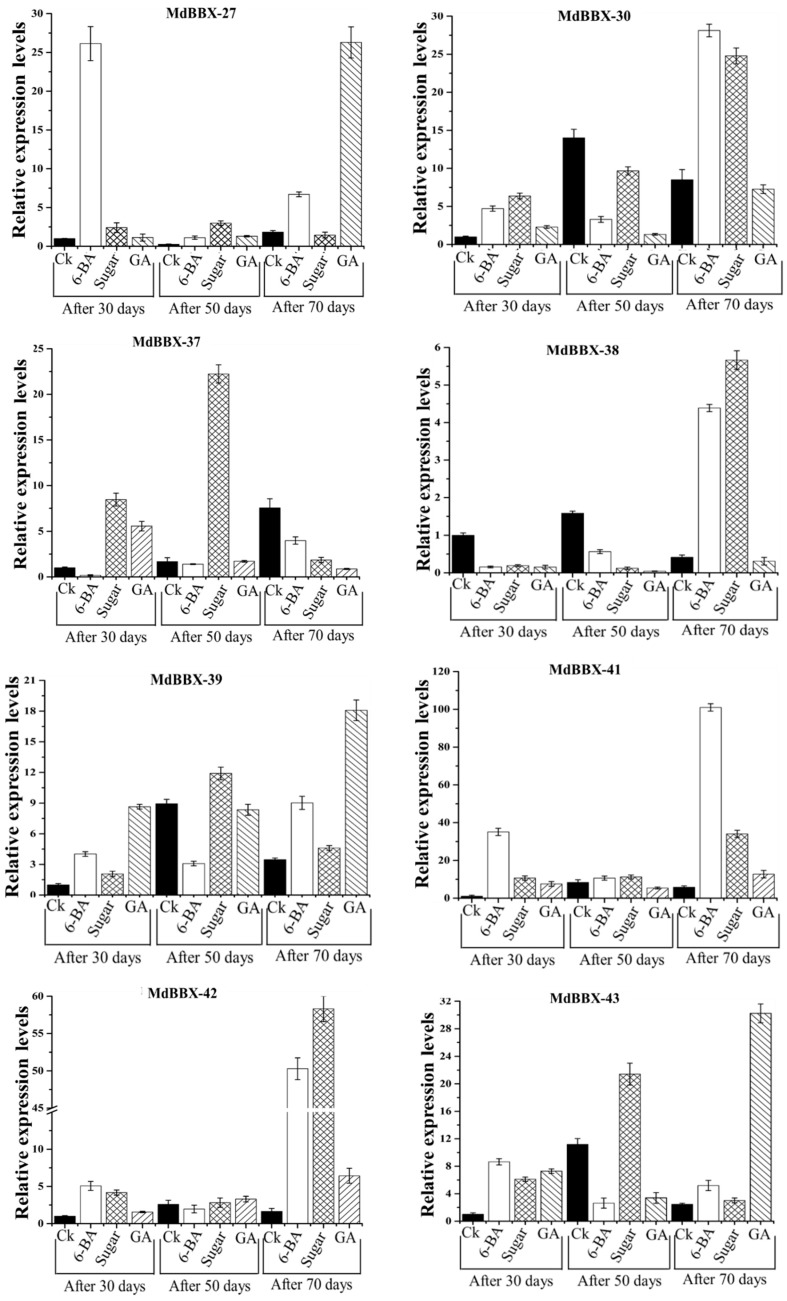
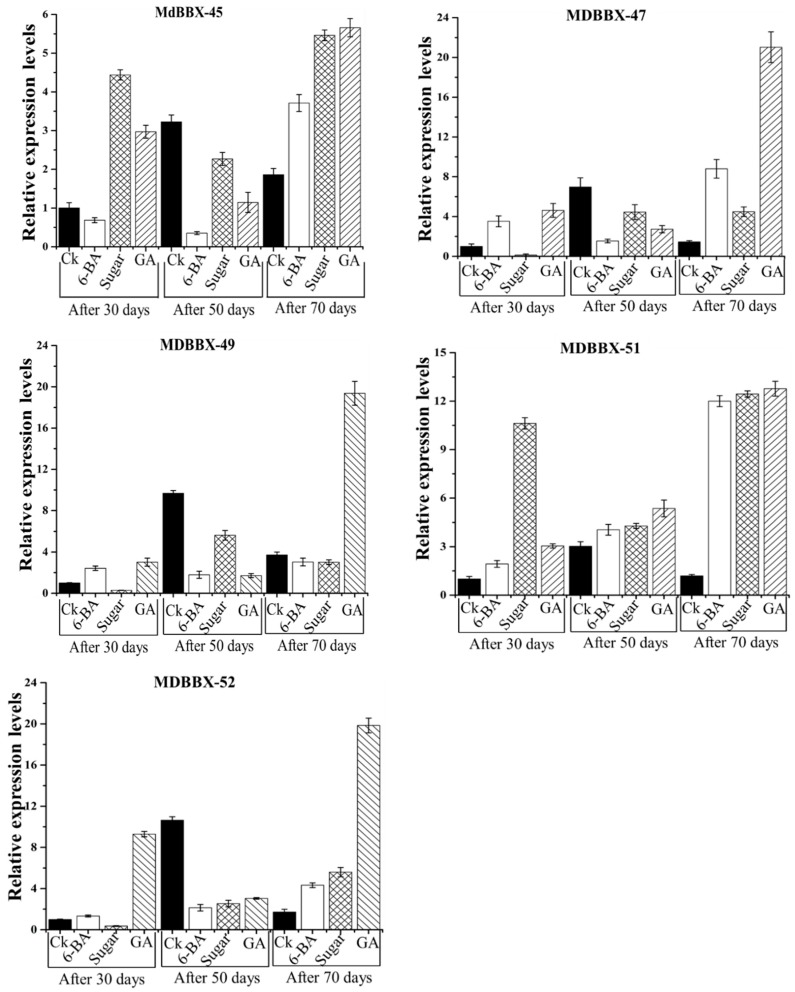
Figure 9.
Inducible expression profile of apple BBX gene family members in response to flowering-related treatments (6-BA, Sugar, and GA), where Ck represents the control, 6-BA represents 6-benzylaminopurine, and GA represents gibberellins. The x-axis indicates the treatment. The y-axis shows the relative expression level of each treatment compared to control (Ck). The error bars indicate the standard deviations of the three independent qRT-PCR replicates.


