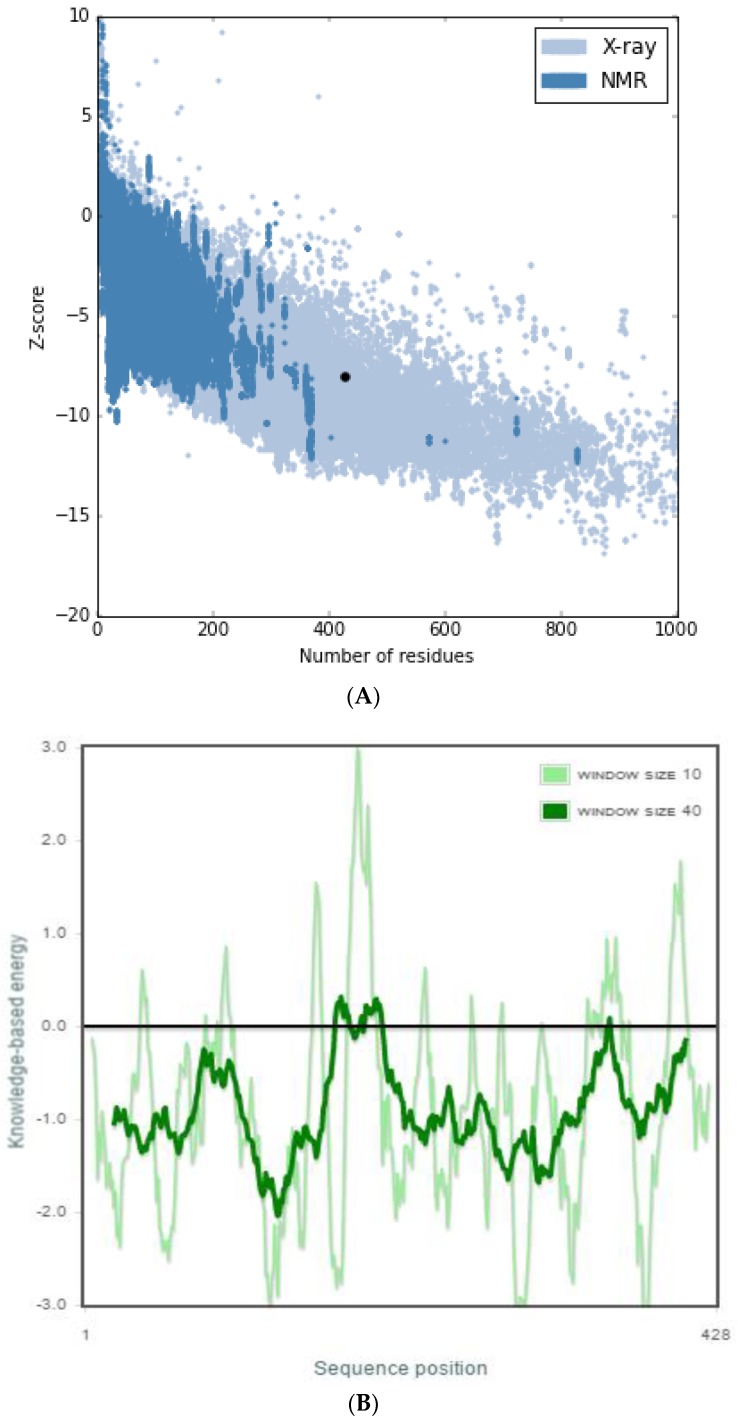
Figure 2.
ProSA web z-score and energy graph of ICL modeled protein. (A) The Z-score of ICL (represented in dot) was present in the range of all protein chains in the Protein Data Bank determined by X-ray crystallography and nuclear magnetic resonance spectroscopy with respect to their sequence length. (B) Energy plot of the ICL protein model.

