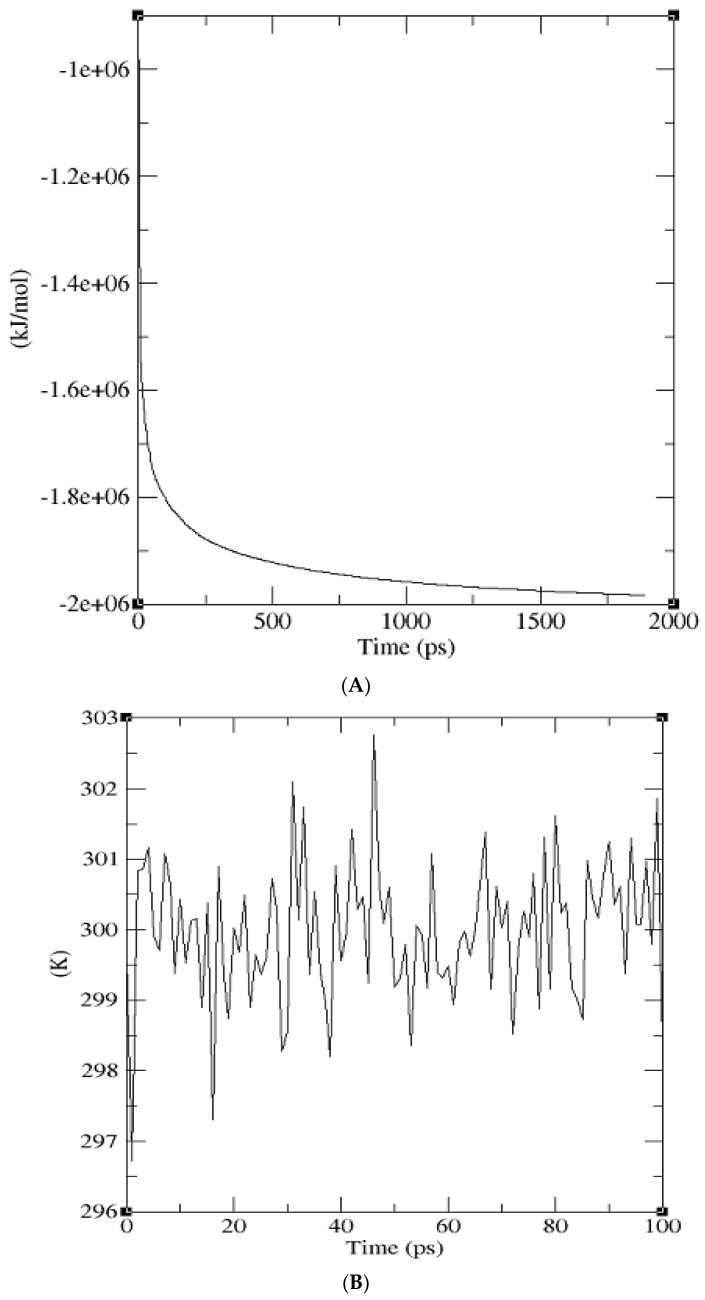
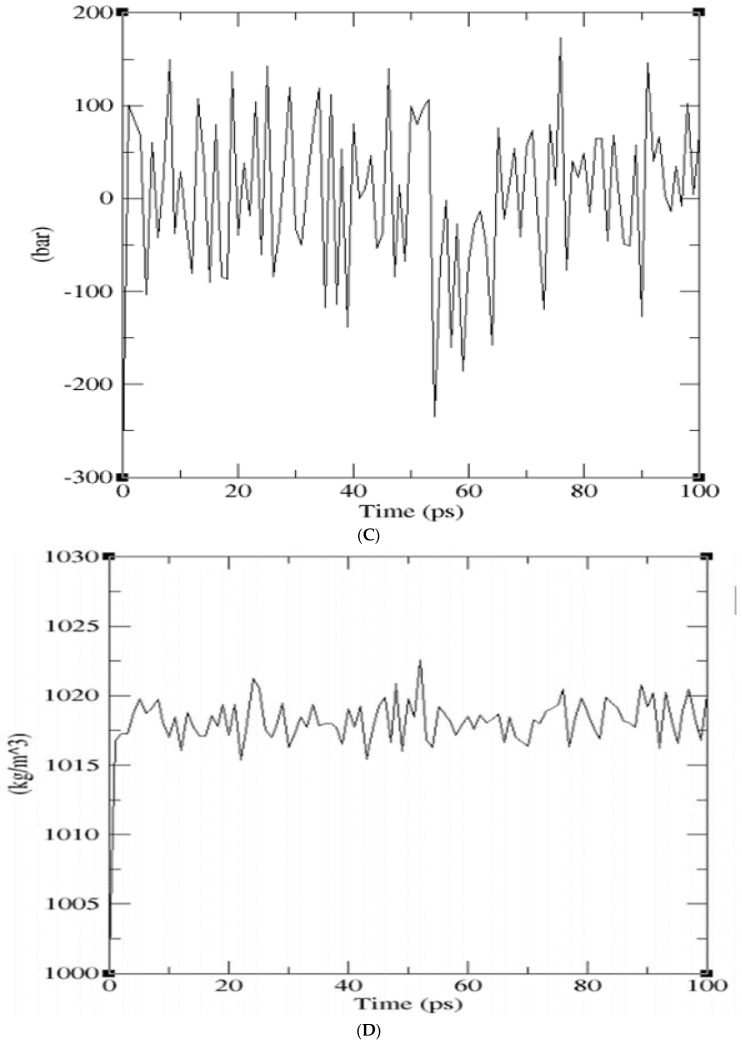
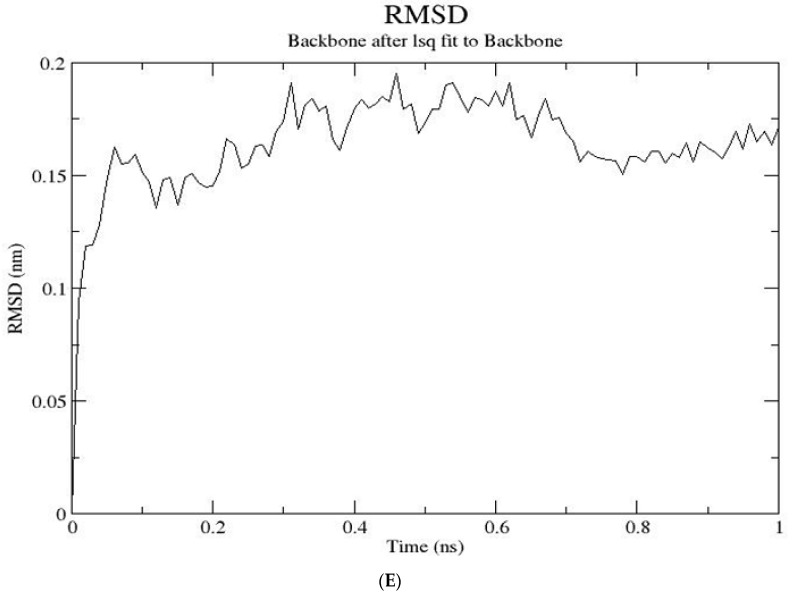
Figure 4.
Graphs generated from molecular dynamics simulation. (A) Potential energy against time graph of the energy minimized protein produced from GROMACS. The overall potential energy of the model achieved after simulation was −1.9786255e+06 kcal/mol. (B) Temperature against time graph showing that the protein temperature was simulated within 300 K. (C) A graph of pressure against the time of the simulated protein model. The pressure laid within 1 bar over the period of 100 ps. (D) Density against the time graph of the protein after simulation led to an average density of 1018.14 kg/m3. (E) RMSD graph with deviation stabilizing around 1.6 Å at the end of 1 ns production run.


