
Figure 20.
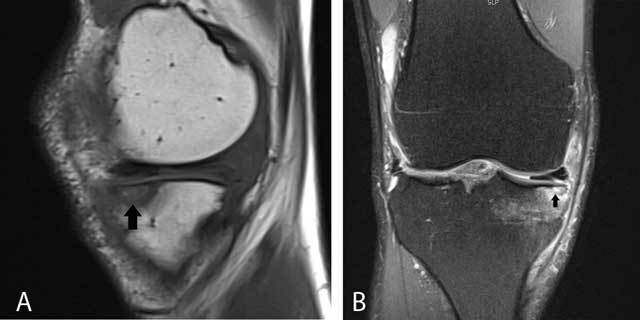
Subchondral stress fracture initially misinterpreted as an osteochondral fracture.
Sagittal T1-WI (A) and coronal FS T2-WI (B) showing a subchondral hypointense band-like structure (arrow) with surrounding bone marrow edema on FS T2-WI.
Official websites use .gov
A
.gov website belongs to an official
government organization in the United States.
Secure .gov websites use HTTPS
A lock (
) or https:// means you've safely
connected to the .gov website. Share sensitive
information only on official, secure websites.
Subchondral stress fracture initially misinterpreted as an osteochondral fracture.
Sagittal T1-WI (A) and coronal FS T2-WI (B) showing a subchondral hypointense band-like structure (arrow) with surrounding bone marrow edema on FS T2-WI.