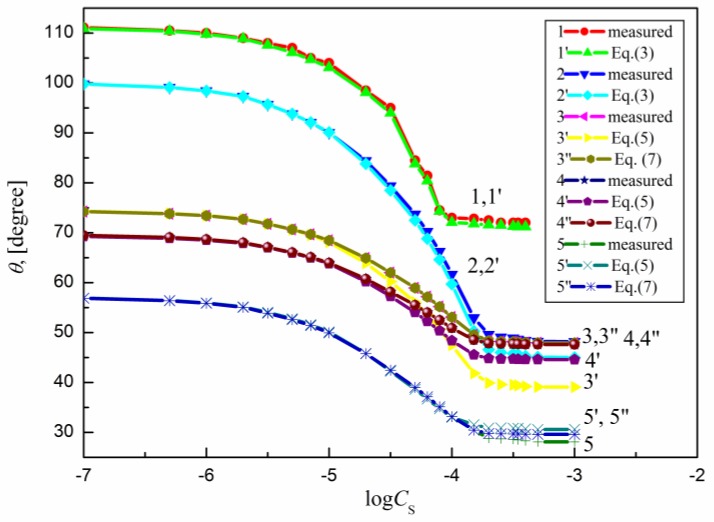
Figure 3.
A plot of the contact angle () of the aqueous solution of DM on the PTFE (curves 1 and 1′), PE (curves 2 and 2′), PMMA (curves 3, 3′ and 3′′), nylon 6 (curves 4, 4′ and 4′′) and quartz (curves 5, 5′ and 5′′) against the logarithm of DM concentration (). Curves 1–5—the measured values, curves 1′ and 2′—the values calculated from Equation (3), curves 3′, 4′ and 5′—the values calculated from Equation (5) and curves 3′′, 4′′ and 5′′—the values calculated from Equation (7).

