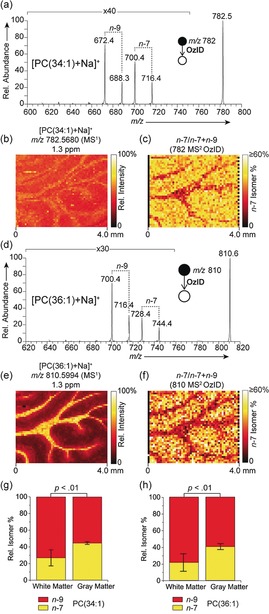
Figure 1.

a) MALDI‐OzID spectrum of [PC(34:1)+Na]+ ions revealing the presence of n−9 and n−7 db isomers. b) The corresponding full‐scan FTMS image of the [PC(34:1)+Na]+ ion (m/z 782.5680) and c) fractional distribution image of n−7 and n−9 isomers (n−7)/(n−7+n−9)) showing an enrichment of the n−7 isomer in the gray matter. d–f) Analogous spectra and images obtained for [PC(36:1)+Na]+, again revealing an enrichment of the n−7 isomer in the gray matter. OzID and full‐scan‐FTMS data were acquired from consecutive tissue sections. Graphs show the n−7 and n−9 relative isomer percentages for g) PC(34:1) and h) PC(36:1) within the white and gray matter. Error bars represent coefficient of variation from each region (n=5 each for white and gray matter regions).
