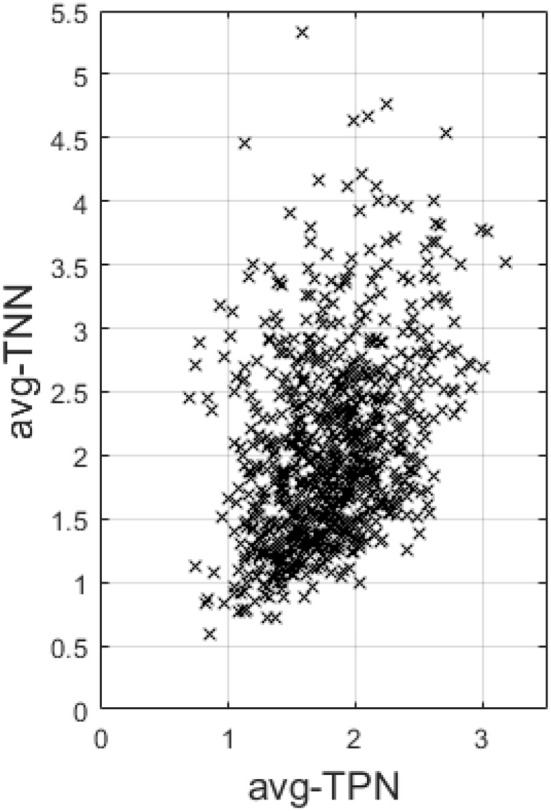
Figure 5.

This figure plots the average Fisher's z-transformed correlation within TNN (avg-TNN) against that computed within TPN (avg-TPN) across the entire sample. There is a highly significant positive correlation (r = 0.37 and p = 1.4e-28) between the two, suggesting a synergistic relationship between them than antagonistic.
