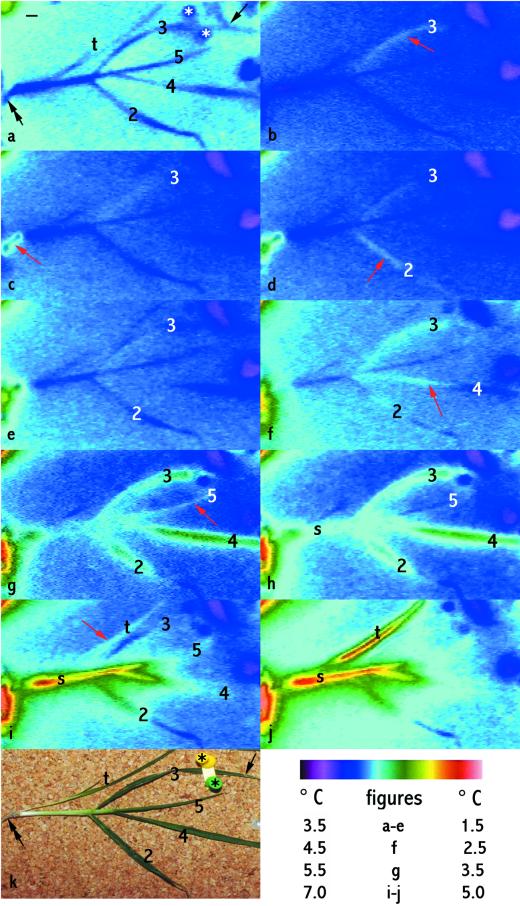
Figure 1.
Sequential freezing of parts of a barley plant during cooling in a controlled environment chamber showing spread of ice through the plant, including the first (red arrows) and second freezing events in a number of leaves (leaves 2–5) and freezing of roots (black, double-headed arrow), a leaf sheath (s), and secondary tiller (t). IRVT images are shown in time order from before the plant began to freeze (a) to when extensive freezing had occurred (j). k is a visible light image taken when freezing was complete. Leaves are numbered from the second to the fifth leaf to emerge (the first leaf was removed before the test). The plant was removed from soil and placed flat on a cork surface and exposed to subzero cooling. The stars in a and k mark two pins holding down a strip of plastic that gently held leaf 3 in contact with ice (indicated by a single-headed black arrow) to initiate freezing. Black bar (in a) = 1 cm. The color scale table (bottom right) indicates the temperature scale for each figure. Leaf 3 froze first and showed two freezing events. The warming of leaf 3 in b (red arrow) compared with in a indicates freezing. The leaf then cooled (c–e). It warmed again (f), indicating a second freezing event, and reached a higher temperature than in the first freezing event (compare g and h with b), and then cooled again (i). Roots froze second (red arrow in c). Leaf 2 froze next (red arrow indicates warming of the leaf in d) and also showed two freezing events: it cooled (e) and then warmed again (starting in f and continuing in g and h), finally cooling again. The sheath of leaf 2 (s) also froze (second freezing event shown in h–j). Leaf 4 froze next, ice spreading up the leaf (red arrow in f; the second freeze is shown in g–h and cooling in i) and the last leaf to freeze was leaf 5 (red arrow in g, cooled in h, second freezing event shown in i). The secondary tiller froze (red arrow in i; the second freezing event is shown in j).

