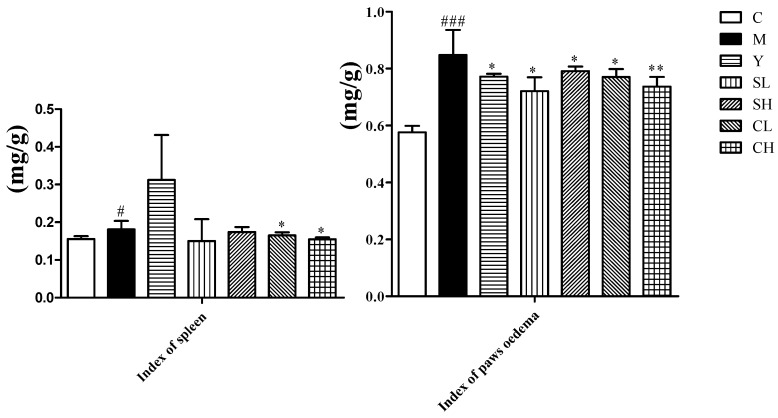
Figure 2.
Effects of ST and CT on index of paws oedema and spleen in AA rats. Values are presented as mean ± SD, n = 8. ** p < 0.01 compared with the AA model group; * p < 0.05 compared with the AA model group. ### p < 0.001 compared with the control group; # p < 0.05 compared with the control group.

