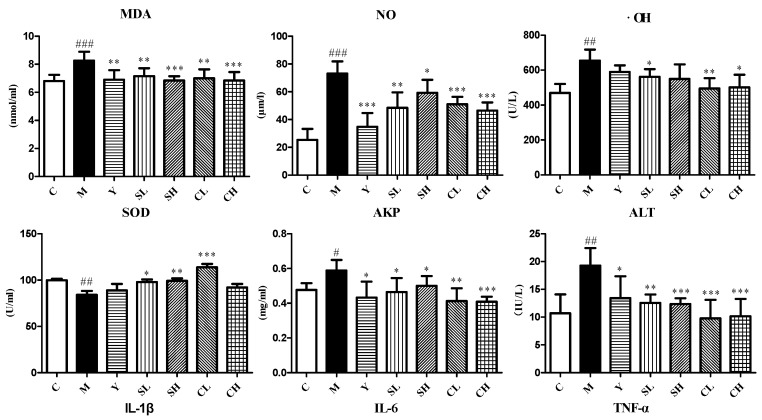
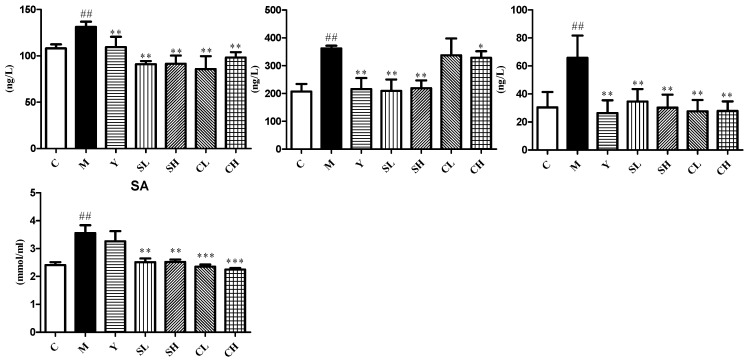
Figure 4.
Determination of MDA, NO, ·OH, SOD, AKP, ALT, IL-1β, IL-6, TNF-α and SA in serum among all groups. Values are presented as mean ± SD, n = 8. *** p < 0.001 compared with the AA model group; ** p < 0.01 compared with the AA model group; * p < 0.05 compared with the AA model group. ### p < 0.001 compared with the control group; ## p < 0.01 compared with the control group; # p < 0.05 compared with the control group.


