An official website of the United States government
Here's how you know
Official websites use .gov
A
.gov website belongs to an official
government organization in the United States.
Secure .gov websites use HTTPS
A lock (
) or https:// means you've safely
connected to the .gov website. Share sensitive
information only on official, secure websites.
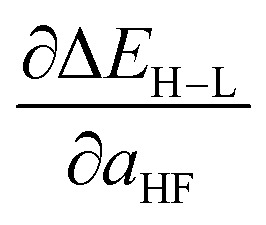
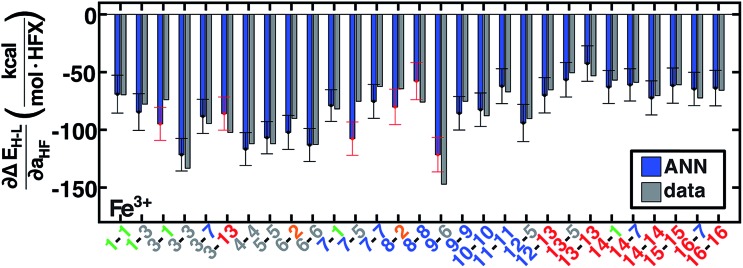
 , in kcal per mol per HFX, for Fe3+ complexes. Complexes are labeled as equatorial and then axial ligands according to the numbering indicated in