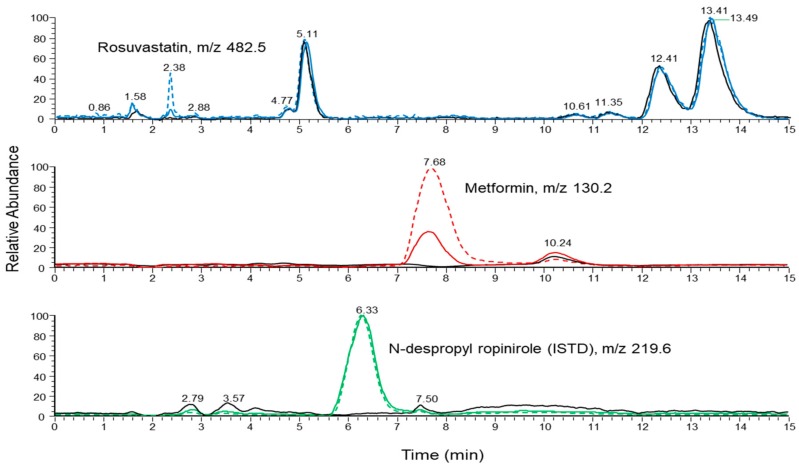
Figure 4.
Ion chromatogram (SIM mode) of a blank human plasma sample (black line) overlaid with ion chromatograms (SIM mode) of calibration spiked plasma samples at 2 ng mL−1 (solid line) and 20 ng mL−1 (dashed line) of rosuvastatin (blue line), 100 ng mL−1 (solid line) and 1000 ng mL−1 (dashed line) of metformin (red line) and 190 ng mL−1 of ISTD (green line).

